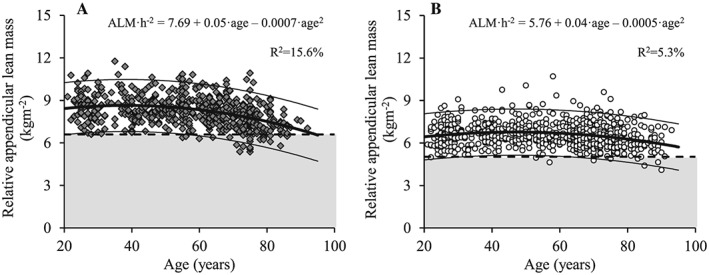
Figure 4.

The association between age and relative appendicular lean mass for men (A; dark grey diamonds) and women (B; white circles). Regression line (wide solid line) and 95% prediction interval (narrow solid line), T score equal to –2.0 (dashed line), data more than 2 SD below the young adult reference mean (shaded area), regression equations and adjusted R 2 values are shown. ALM/h2, relative appendicular lean mass (normalized to height squared).
