Fig. 11.

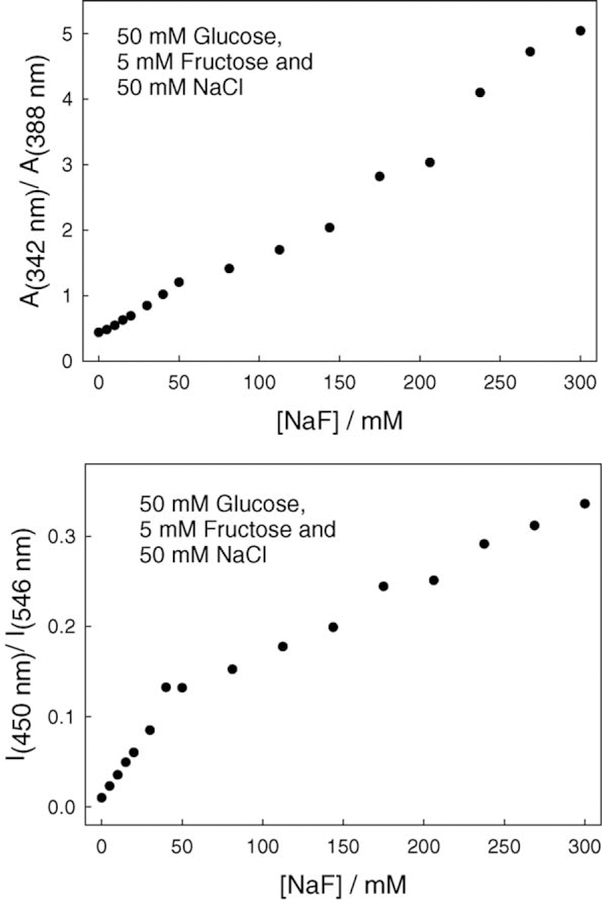
Absorption ratiometric plot for BAQBA with increasing fluoride concentrations, with a constant 50 mM glucose, 5 mM fructose, and 50 mM chloride (top), and the fluorescence emission ratiometric plot for the same with λex = 358 nm (bottom).

Absorption ratiometric plot for BAQBA with increasing fluoride concentrations, with a constant 50 mM glucose, 5 mM fructose, and 50 mM chloride (top), and the fluorescence emission ratiometric plot for the same with λex = 358 nm (bottom).