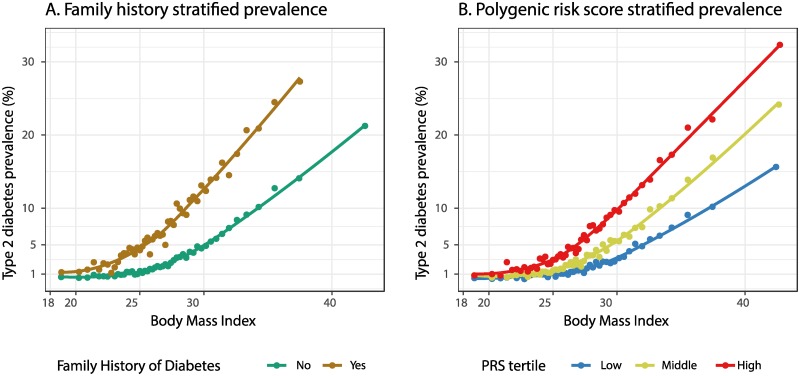
Fig 1. Variation of type 2 diabetes prevalence with BMI, family history, and polygenic risk.
Within each category, 50 bins of equal numbers of individuals with consecutive BMI values were selected, and the average BMI and percent of individuals diagnosed with type 2 diabetes are shown. Curves were fit using LOESS regression [33]. Individuals were stratified by (A) family history of diabetes or (B) polygenic risk score (PRS) tertile.

