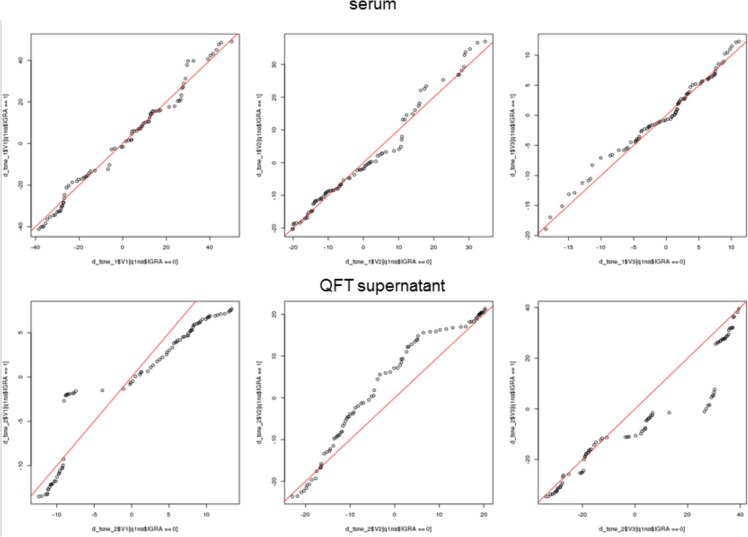
Fig 7. qq-plots for the components of the t-SNE projection.
The top panel corresponds to the serum and the bottom to the QFT supernatant samples. The leftmost plot in each panel corresponds to the first coordinate of the embedding, the central plot to the second and the rightmost to the third coordinate of the embedding. The x-axis corresponds to IGRA negative and the y-axis to the IGRA positive samples. The red line is the diagonal. In the top panel (serum) the distribution of the consecutive components of the embedding is much more similar between IGRA positive and negative individuals, then in the bottom panel (QFT supernatants).

