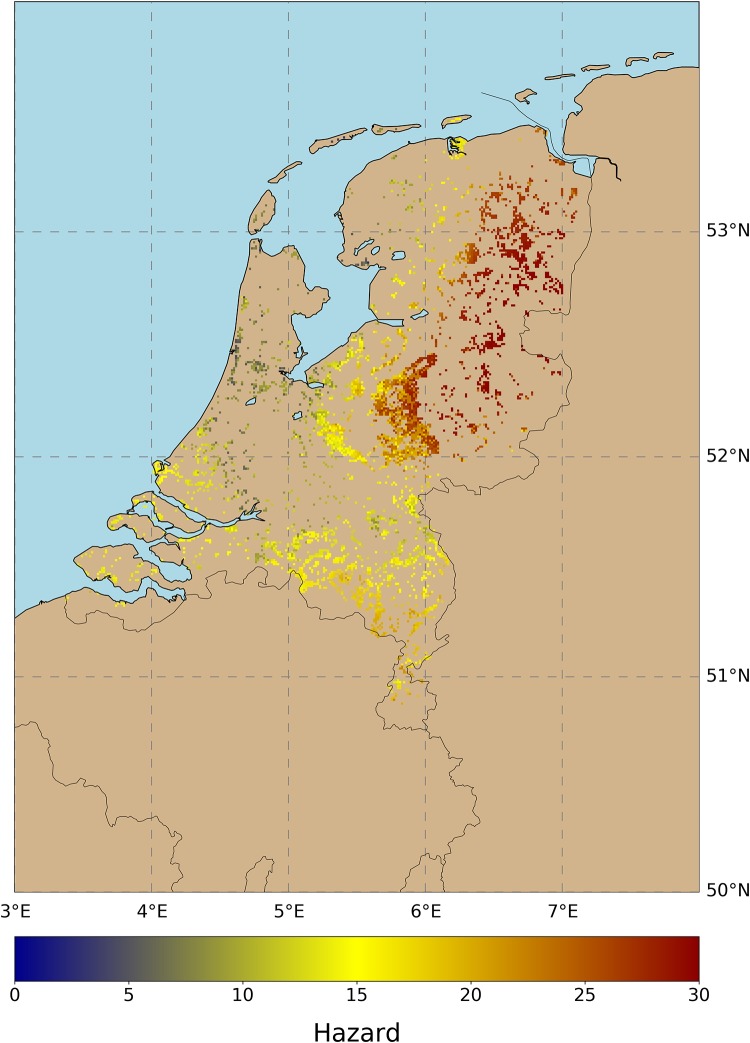
Fig 1. Tick activity per 1km grid cell.
This tick activity estimation is provided by the data-driven model in [35], which is capable of predicting daily tick activity. We run this model for each day during the period (2006–2014) and we calculated a robust long-term metric of hazard, showing the maximum mean tick activity for the entire period. As seen, hazard is minimum along the coastline and maximum in the northeast of the country.

