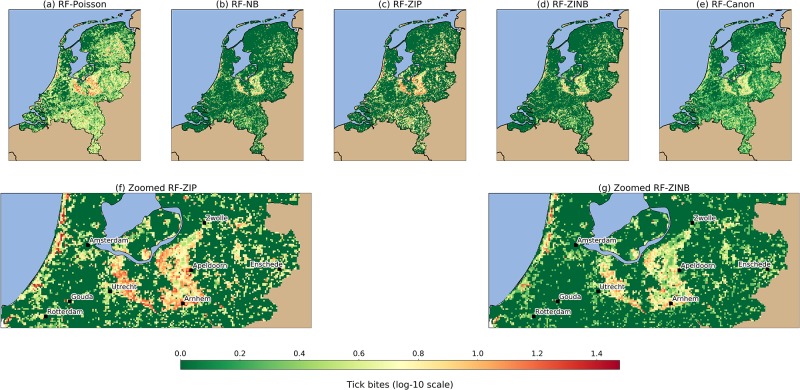
Fig 8. Tick bite risk maps produced by combining RF with each of the count data models.
The logarithmic (log-10) scale corresponds to the range of 0–30 predicted tick bites per grid cell. The upper row (a-e) shows the general overview of the models, whereas the bottom row shows a close-up for the ZIP (f) and ZINB (g) models. The NB (b) and ZINB (d) models are better suited to delineate regions with low or inexistent tick bite risk, thus they present sharper declines between different land uses. The ZIP (c) model is capable of predicting the risk of tick bite over a range of values, this is why its associated map presents smooth and gradual changes across the study area. POI (a) and RF (e) are over/under predicting, respectively, since the former finds risk in most locations of the country, whereas the latter yields and almost-homogeneous prediction. The visual inspection of the zoomed models (f, g) identify popular places for recreation intensely visited by citizens. The forested areas between Utrecht, Apeldoorn, and Arnhem, together with the recreational areas along the coast are regions where tick bite risk is particularly high.

