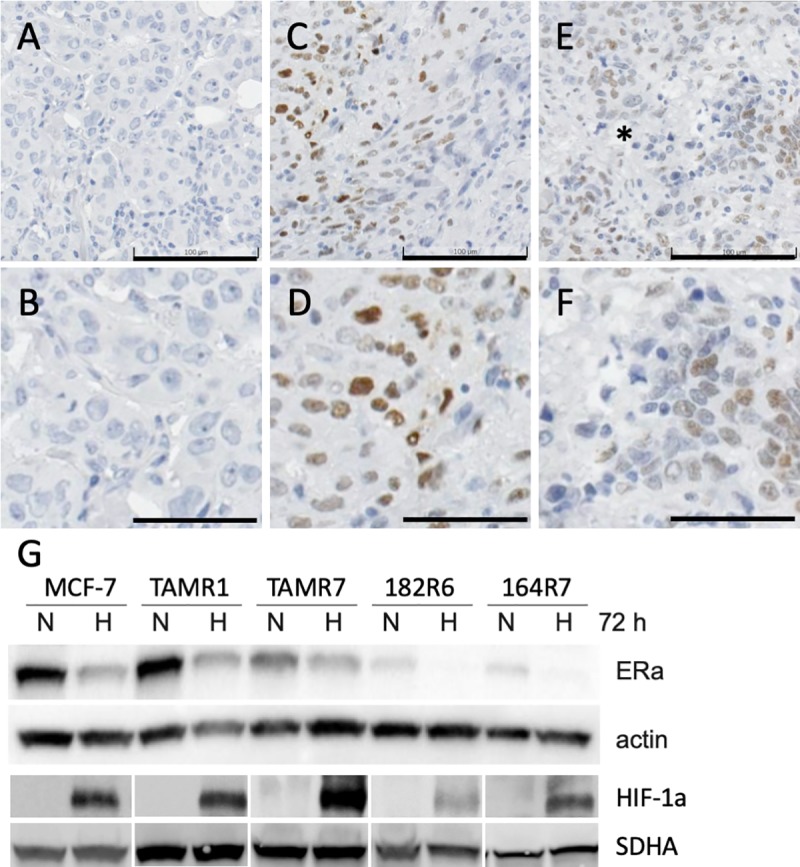
Fig 2. HIF-1α immunohistochemistry (IHC) and immunoblot.

Human breast cancer sample examples from the contralateral breast cancer cohort negative (A, B) and positive (C-F) for HIF-1α IHC. * marks a necrotic area with perinecrotic cells staining positive for HIF-1α. A, C and E size bars 100 μm, B, D and F size bars 50 μm. Immunoblot analysis of ERα- and HIF-1α expression in MCF-7 breast cancer cells and in four derived strains with induced tamoxifen or fulvestrant resistance (G). Actin was used as loading control for ERα and SDHA for HIF-1α. In Fig 2D images have been spliced, as indicated by spacing between panels, to include all relevant data in one figure. The entire width of HIF-1α-immunoblots are shown in S1 Fig with places for splicing demarked with vertical black lines. Cells were cultured for 72 h at 21% (normoxia, N) or 1% (hypoxia, H) oxygen.
