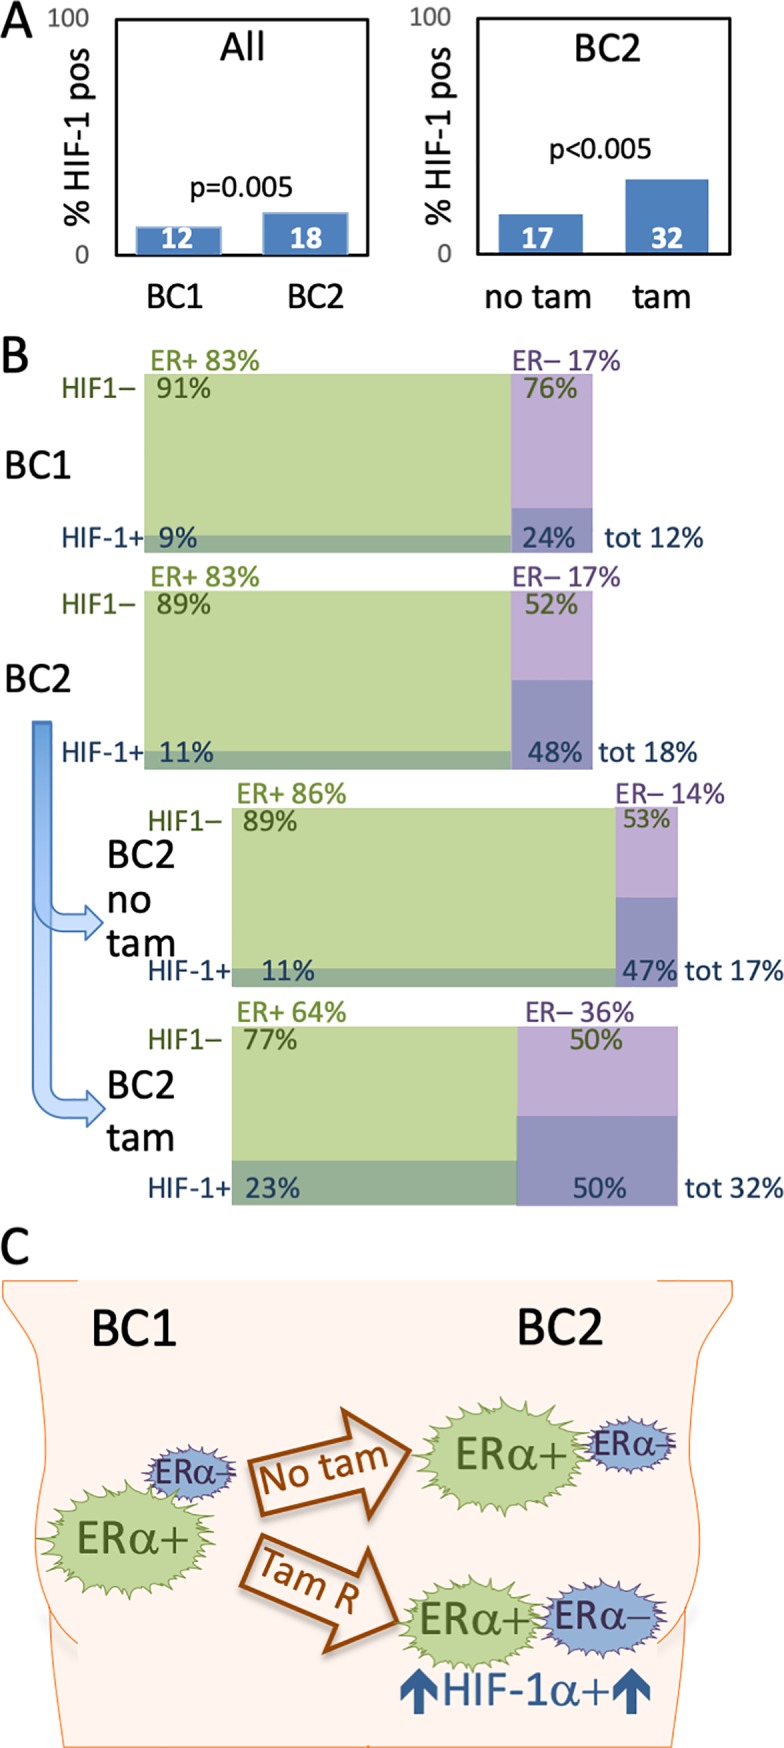
Fig 3. Fraction of HIF-1α-positivity in the contra lateral breast cancer material.

Percentage of HIF-1α-positive tumors, in the entire material (left chart) and in BC2, with or without prior adjuvant tamoxifen (right chart) (A). Displaying the percentage of ERα-positive (ER+, > = 10% of cancer cells positive, green in charts), ERα-negative (ER–, < 10% of cancer cells positive, purple in charts), HIF-1α-positive (HIF-1α +, > = 1% of cancer cells positive, darker shade in charts) and HIF-1α negative (HIF-1α –, < 1% of cancer cells positive, lighter shade in chart) tumors. Data extracted from Tables 1 and 2. (B). Metachronous CBC (BC2) formed despite on-going tamoxifen treatment are more often HIF-1α positive than first tumors (BC1) and BC2 without prior tamoxifen. ER-negative tumors are also more frequent in the BC2-tumors diagnosed during on-going tamoxifen as is combined HIF-1α-positivity and ERα-negativity. Size of tumor symbol arbitrarily corresponds to phenotype frequency (C).
