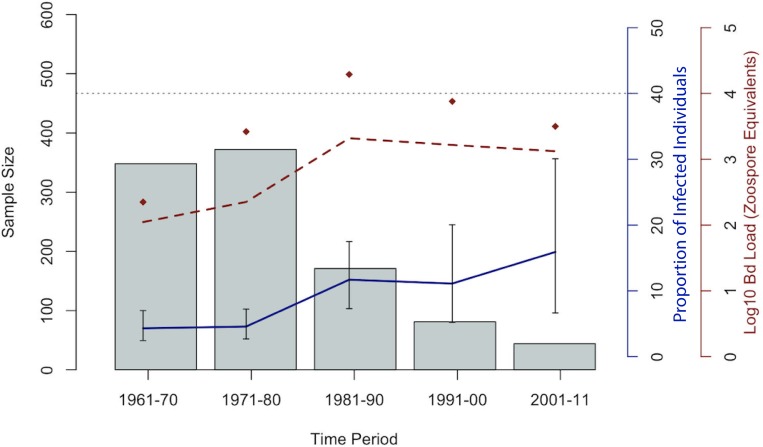
Fig 2. Emergence of Bd in Costa Rica from 1961–2011.
For samples tested in every decade between 1961–2011, the solid blue line represents the proportion of individuals tested positive for Bd. The average infection intensity, measured by the zoospore equivalents detected, is represented by the dashed red line. The maximum zoospore equivalents value is represented by red diamonds and gray bars represent the number of samples analyzed. The horizontal dashed line at Log10(10,000) marks the Vredenburg 10,000 value, the infection load which has been shown to cause mortality in anurans [13].

