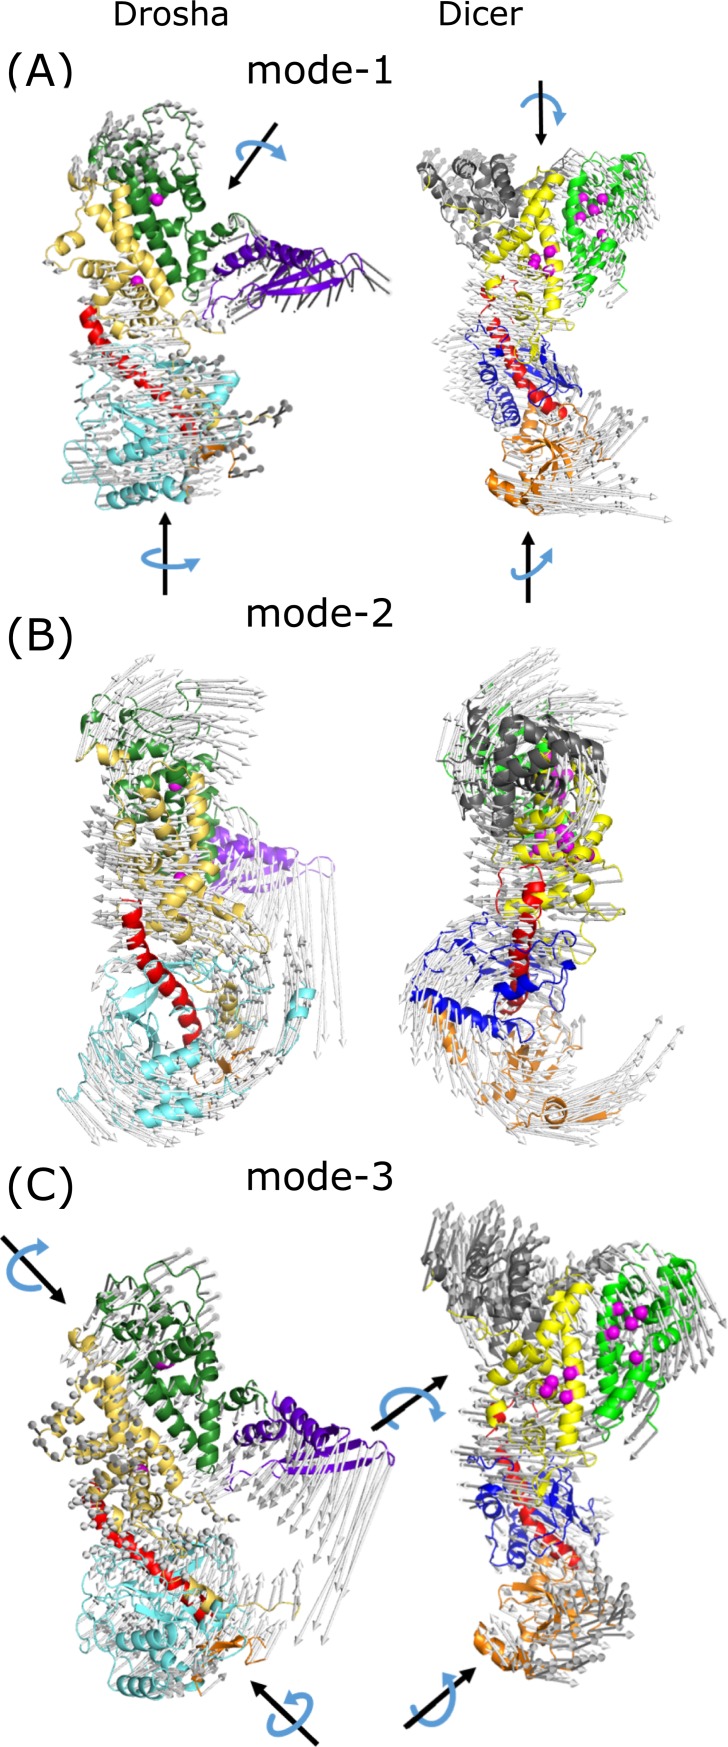
Fig 5. Porcupine plots of three slowest modes of Drosha and Dicer.
Drosha (left) and Dicer (right) (A) first, (B) second, (C) and third ANM modes. The motion of the first and third modes is dissimilar for the two proteins, while the second mode shows reasonable similarity. Protein ribbon representation is colored according to the domain colors (see Fig 1 legend) and the arrows displaying the movement direction are colored light gray. Black arrows depict the rotation axis, blue arrows show the motion direction. Upper and lower parts of both proteins are moving in an anti-correlated circular shape. Porcupine plots were created using Modevectors [56].

