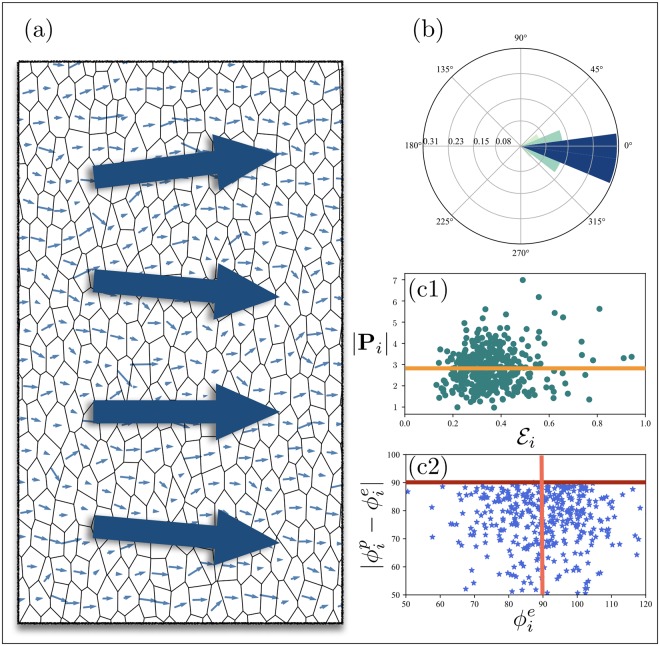
Fig 5.
(a) and (b) represent the final configuration and angular distribution of polarization in an elongated tissue with . Cell-by-cell magnitudes of the dipoles |Pi| versus the magnitudes of elongations , are shown in a scatter plot (c1). The orange line marks the mean magnitude of the cell polarities, . In (c2) the relative angles of the cell dipoles and elongations , are plotted against the angles of the cell elongations. The average angle of elongation, marked by the vertical red line, is 90° with respect to the x-axis. By definition, the relative angles fall below 90° (horizontal dark red line).

