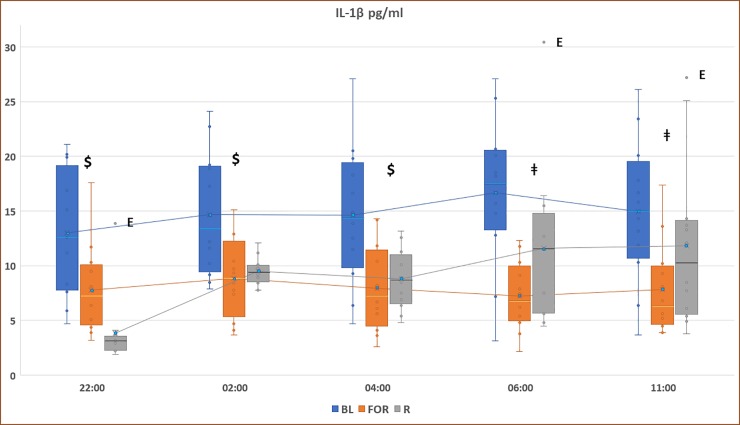
Fig 2. Circadian pattern of plasma IL-1β concentrations at non-fasting baseline (non-fasting BL), fasting outside Ramadan (FOR), and Ramadan.
Plasma levels were presented as box and whisker plot. The upper part of the box represents the 75th percentile, the horizontal line in the box represents the median, the lower part of the box represents the 25th percentile, and the blue circle represents the mean. The whiskers (lines) of the box represents the smallest and largest values that are not minor or extreme outlying values. $ indicates significance between both Ramadan and fasting outside of Ramadan and baseline measurements (BL), (p < 0.05). ǂ indicates significance between FOR and BL, (p < 0.05). E: extreme outlier.

