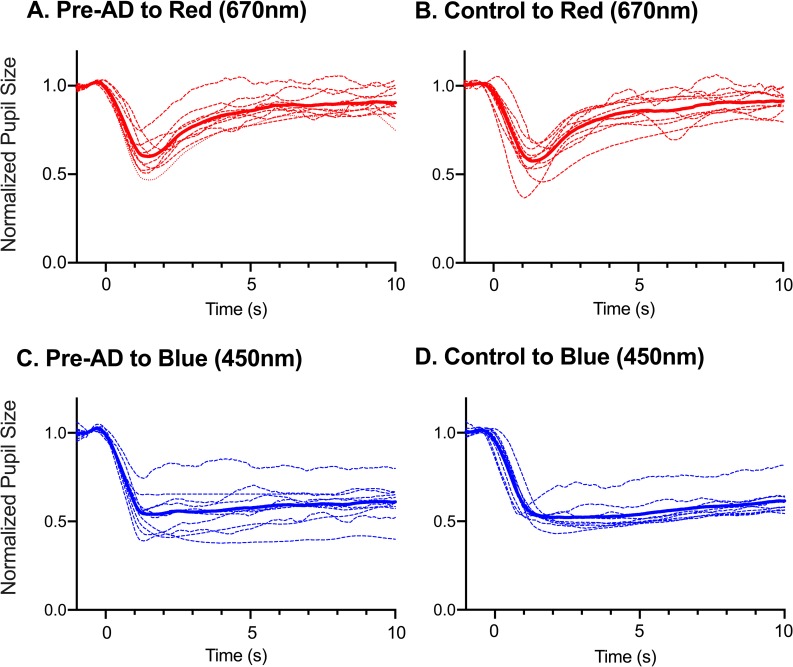
Fig 1. Normalized pupillary light response (PLR) following photopically matched red (620 nm) and blue stimuli (450nm) at 250 or 2.3 log cd/m2.
(A) Following the red stimulus, individual normalized PLRs of pre-AD individuals (n = 10, dashed red) and the average pre-AD PLR (solid red). (B) Individual normalized PLRs in controls (n = 10, dashed red) and the average control PLR (solid red). (C) Following the blue stimulus, individual normalized PLRs of pre-AD individuals (n = 10, dashed blue) and average pre-AD PLR (solid blue). (D) Individual controls (n = 9, dashed blue) and the average control PLR (solid blue). Pre-AD, pre-symptomatic Alzheimer’s disease.

