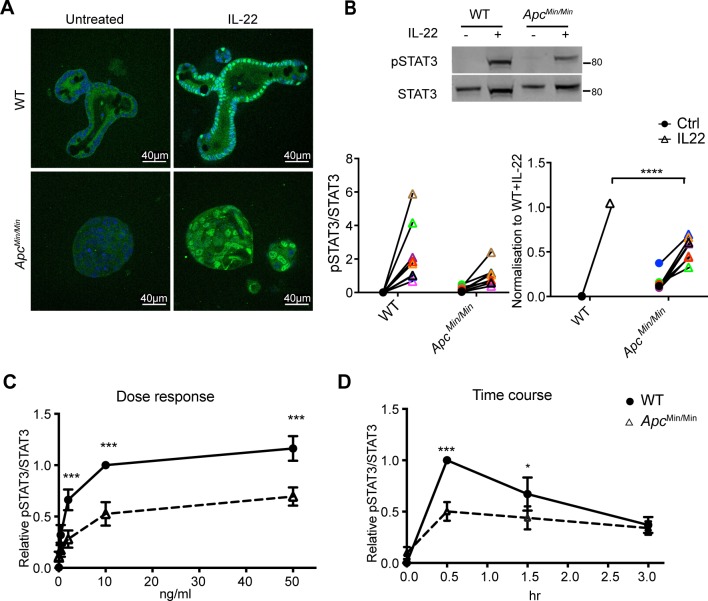
Fig 3. Differences in IL-22–induced STAT3 phosphorylation in WT and ApcMin/Min organoids.
(A). WT and ApcMin/Min organoids were stimulated with IL-22 (10 ng/ml) for 0.5 hours. Organoids were fixed and immunostained with STAT3 antibodies (green), and nuclei were visualised with Hoechst (blue). (B). Immunoblots and corresponding quantification of pSTAT3 (Tyr705) in WT and ApcMin/Min organoids with or without IL-22 stimulation. Relative level is expressed as the ratio of pSTAT3 (Tyr705) to total STAT3 in each sample and normalised to the corresponding ratio in WT organoids treated with IL-22 in each experiment. (C) Dose response of pSTAT3 (Tyr705) in organoids treated with 0.4, 2, 10, or 50 ng/ml IL-22 for 0.5 hours. (D). Time course of pSTAT3 (Tyr705) in organoids stimulated with IL-22 (10 ng/ml) for 0.5, 1, or 3 hours. pSTAT3/STAT3 levels in panels C and D were quantified by immunoblotting and normalised to WT + IL-22 at 10 ng/ml IL-22 and at 0.5 hours, respectively. *p < 0.05, **p < 0.01, ***p < 0.001, two-way ANOVA. Numerical values for (B), (C), and (D) can be found in S1 Data. Apc, adenomatous polyposis coli; IL-22, interleukin-22; pSTAT3, phosphorylated STAT3; STAT3, signal transducer and activator of transcription 3; Tyr705, Tyrosine 705; WT, wild-type.

