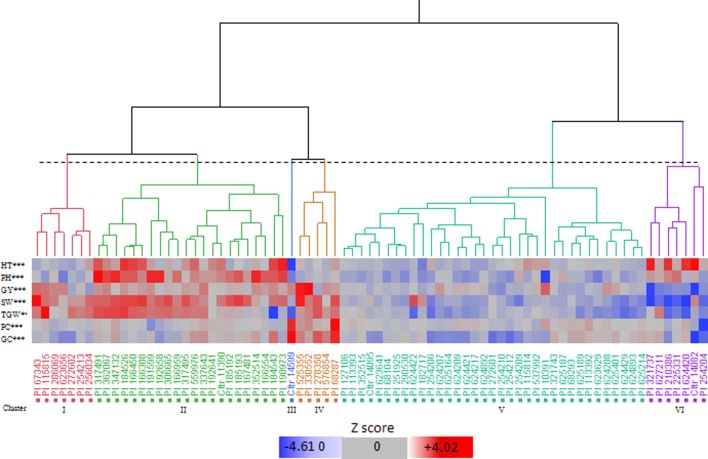
Figure 1.
Hierarchical cluster analysis dendrogram (Ward’s method) and pattern map of the values of the bio-agronomic traits for the 77 Khorasan wheat genotypes. HT, heading time; PH, plant height; GY, grain yield; SW, specific weight; TGW, 1000-grain weight; PC, protein content; GC, gluten content. Dotted line, 20% threshold point delineating six clusters. ***, significant differences at 0.001 level among clusters (Tukey-Kramer test).

