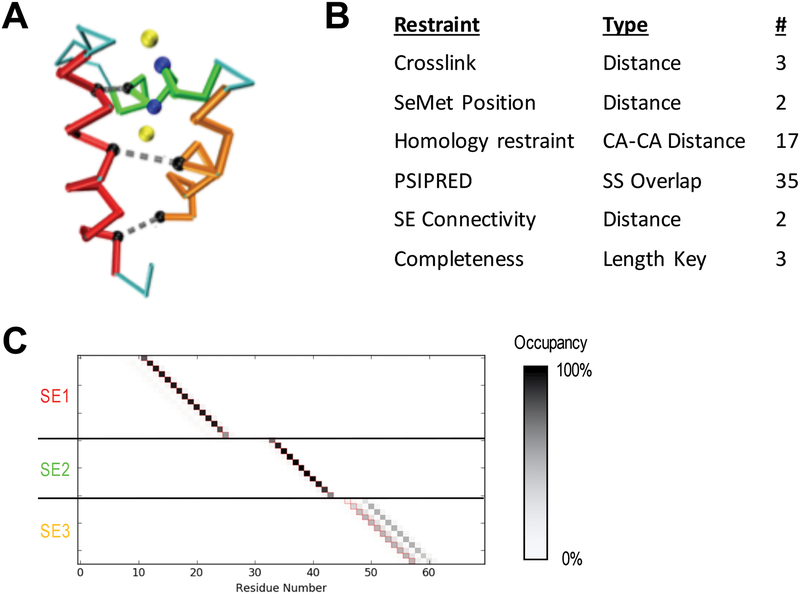
Figure 5: Simulated benchmark results.
A) Cα trace of the human MLL5 PHD domain (PDB 2LV9) showing the three identified SEs (red, green, orange), distance restraints used (grey dashed lines connecting black residues), and SeMet restraints (yellow atoms are anomalous peaks and blue atoms are the corresponding Methionine Cαs). B) Table of restraints for SE localization using IMP:SSEThread. C) Residue occupancy of the top 5000 threading models following enumeration of all possible states. Each box represents the mapping of a residue in sequence (X-axis) to a coordinate in a structure element (Y-axis). A black box indicates that 100% of the top models map the corresponding residue to the structure element coordinate. SE3 shows multiple threading possibilities that are equally likely. The correct threading solution is indicated by the red outline of the boxes.

