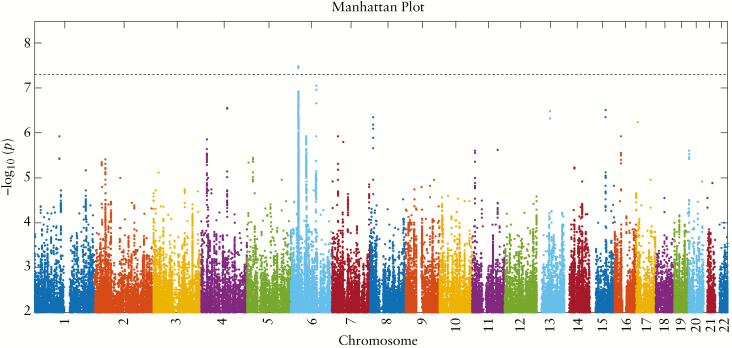
Figure 1.
Manhattan plot showing the –log10[p] values for each single nucleotide polymorphism [SNP] in the HRC Imputation Panel with p < 0.01, computed using Bolt-LMM and plotted using an in-house MATLAB script which we have made publicly available on the MATLAB File Exchange.16 The horizontal dashed line is the genome-wide significance threshold at p = 5 × 10⁻⁸. The strongly significant signal on chromosome 6 lies in the HLA region, with lead SNP rs2596560, p = 3 × 10⁻⁸.

