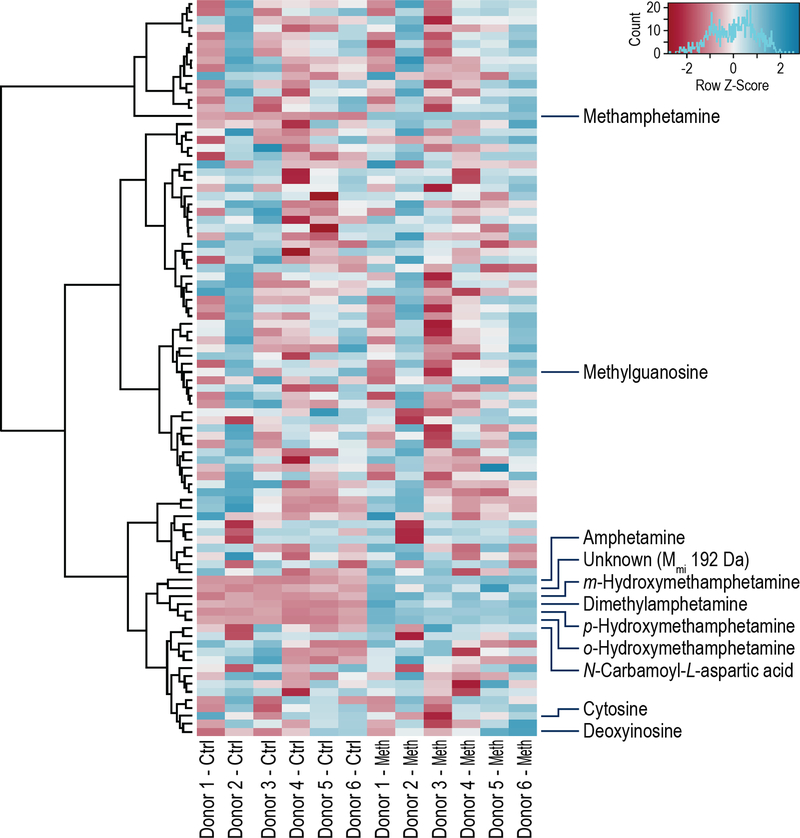
Figure 3.
Heat map comparison of abundance levels for control and Meth conditions; relative downregulation (blue) and upregulation (red). Only metabolites with adjusted p-value < 0.1 are labeled; the compounds in the heat map (top to bottom) are listed in Supporting Information Table S2.

