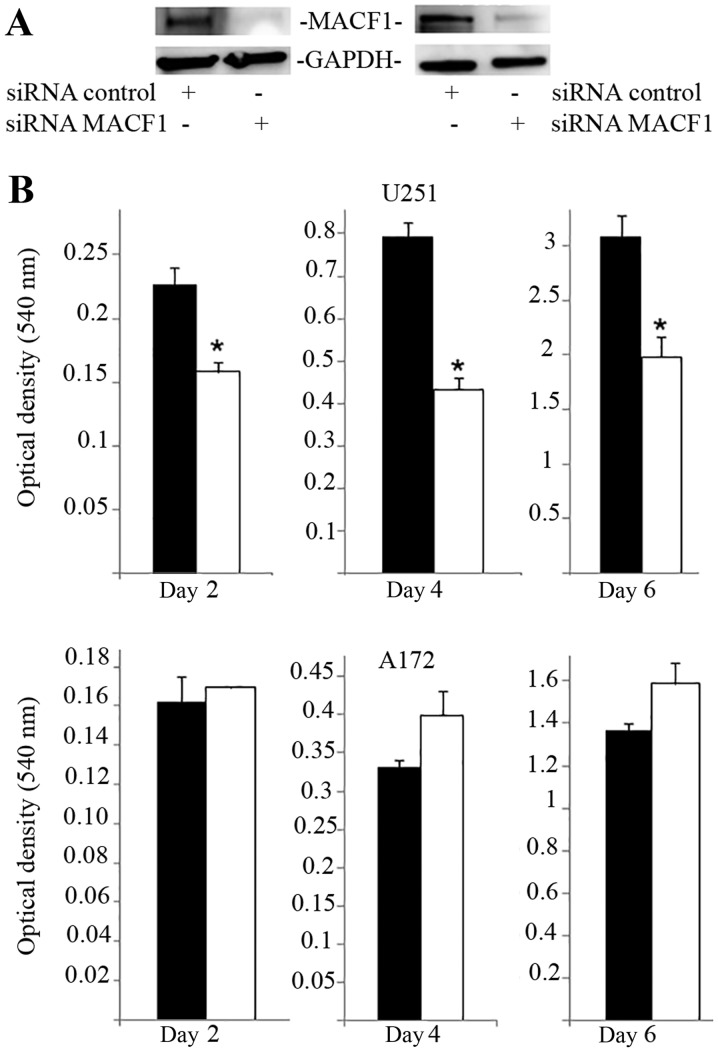
Figure 3.
Proliferative response of glioblastoma cells to MACF1 inhibition. (A) Western blot analysis of U251 and A172 cells treated for six days with MACF1 siRNAs nearly abolished MACF1 expression in U251 and A172 cells. (B) Bar graphs show that reduction in MACF1 levels was accompanied with a significant decrease in the proliferative capacity of U251 cells (*P<0.05 as determined by the Student's t-test; error bars, SE) but not A172 cells. Data shown are representative of at least three independent experiments performed in duplicate. Black bars, control siRNA treated cells; white bars, MACF1 siRNA treated cells.

