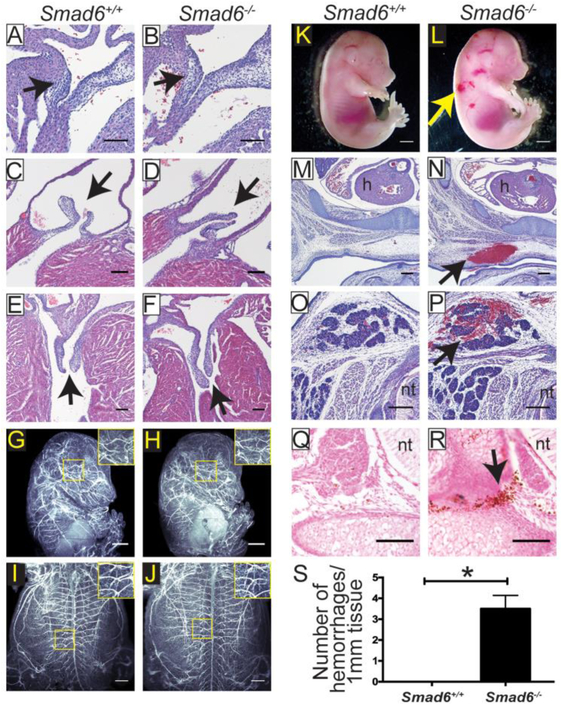
Figure 1. Loss of SMAD6 Results in Embryonic Vessel Hemorrhage at E15.5.
A-B, 10μm paraffin sections of E15.5 heart valve primordia of indicated genotypes stained with Hematoxylin and Eosin (H&E). Arrow, valve primordium; scale bar, 100μm. C-F, 10μm paraffin sections of P4 pulmonary (C-D) and mitral (E-F) valves of indicated genotypes stained with H&E. Arrow, valve; scale bar, 100μm. G-J, Whole mount E15.5 embryos of indicated genotypes stained with PECAM to visualize blood vessels and imaged using light-sheet microscopy. G-H, lateral view; I-J, ventral view. Higher magnification insets reveal no significant vessel patterning differences between Smad6+/+ (G, I) and Smad6−/− (H, J) embryos. Scale bar, G-H,1000μm, I-J, 500μm. K-L, E15.5 whole mount embryos showing hemorrhage in Smad6−/− embryo (L, arrow, hemorrhage); scale bar, 1000μm. M-P, Sections through 2 different E15.5 Smad6+/+ (M, O) and Smad6−/− (N, P) embryos showing hemorrhage (arrow in N, P), stained with H&E; scale bar, 200μm. h, heart; nt, neural tube. Q-R, Prussian Blue-DAB on E15.5 embryo sections used for quantification in Fig 1S. (R, arrow, hemorrhage); scale bar, 100μm. nt, neural tube. S, Quantification of hemorrhage per mm of embryonic tissue. *, P<0.05, statistical significance was assessed using a Student's t-test, Mann-Whitney post-hoc test, 4 replicates.

