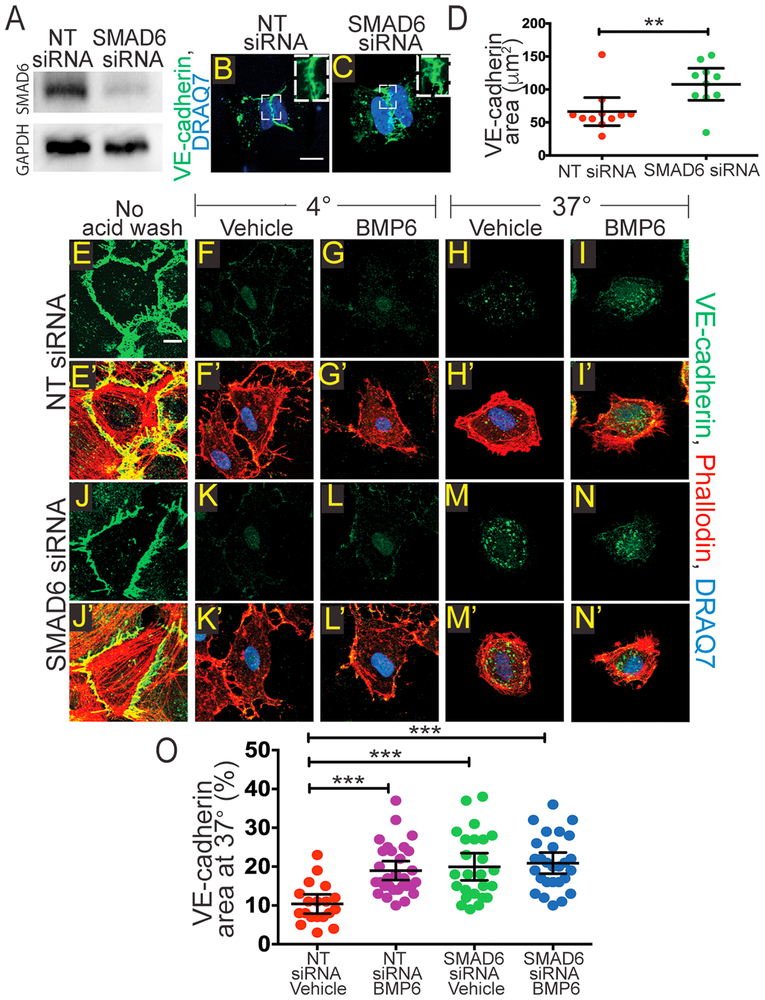
Figure 4: Reduced SMAD6 Levels Promote Changes in EC junction Morphology and VE-cadherin Internalization.
A, Western blot after indicated siRNA treatments. Top, SMAD6 protein; bottom, relative GAPDH. B-C, H-micropatterns; scale bar, 10μm. HUVEC transfected with NT (B) or SMAD6 siRNA (C) and stained with VE-cadherin (green) to visualize adherens junctions and DRAQ7 (blue) to visualize the nucleus. D, Quantification of VE-cadherin area in micropatterns with EC of indicated manipulations. E-N, HUVEC internalization assay with indicated treatments after incubation at 4°C with VE-cadherin antibody; immunofluorescent staining for VE-cadherin (green); scale bar, 10μm. E’-N’, Merged images from E-N to include phalloidin (red) and DRAQ7 (blue); scale bar, 10μm. E-E’, Control with no acid wash or internalization at 37°C. F-F’, G-G’, K-K’, L-L’, Controls kept at 4°C and acid washed, with or without ligand and with indicated siRNA. H-H’, I-I’, M-M’, N-N’, HUVEC with or without ligand and indicated siRNA treatment, incubated at 37°C prior to acid wash. O, Quantification of VE-cadherin internalization (% VE-cadherin area normalized to cell area). Statistics, one-way ANOVA with Tukey's post-hoc test, ***P≤0.001; 3 replicates.

