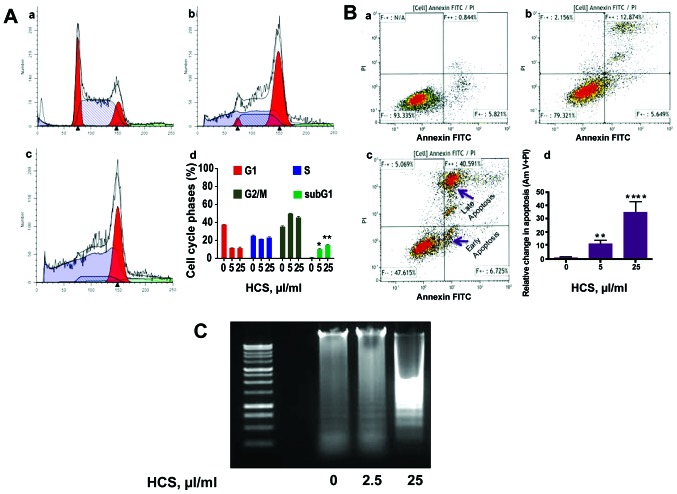
Figure 2.
HCS triggers cell arrest and induces cell death of Ramos cells. Cells were treated with HCS for 24 h. (A) Histograms of Ramos cells treated with vehicle (a), HCS 5 μl/ml (b) and HCS 25 μl/ml (c) and quantitative analysis of the cell cycle alteration elicited by HCS (d). (B) Cells were treated with HCS at similar concentrations illustrated in sub-figure A, and apoptotic cells were assayed by flow cytometry following Annexin V staining, using a FACSCalibur instrument. Each experiment was performed in duplicate and repeated twice independently. Each bar graph represents the mean and the error bars represent ± SEM. *P<0.05, **P<0.01, ****P<0.001 statistically significant difference between HCS treated versus vehicle treated cells. (C) Ramos cells were treated with HCS at 2.5 and 25 μl/ml for 24 h. The DNA was extracted, resolved on a 1% agarose gel, stained with ethidium bromide and photographed.

