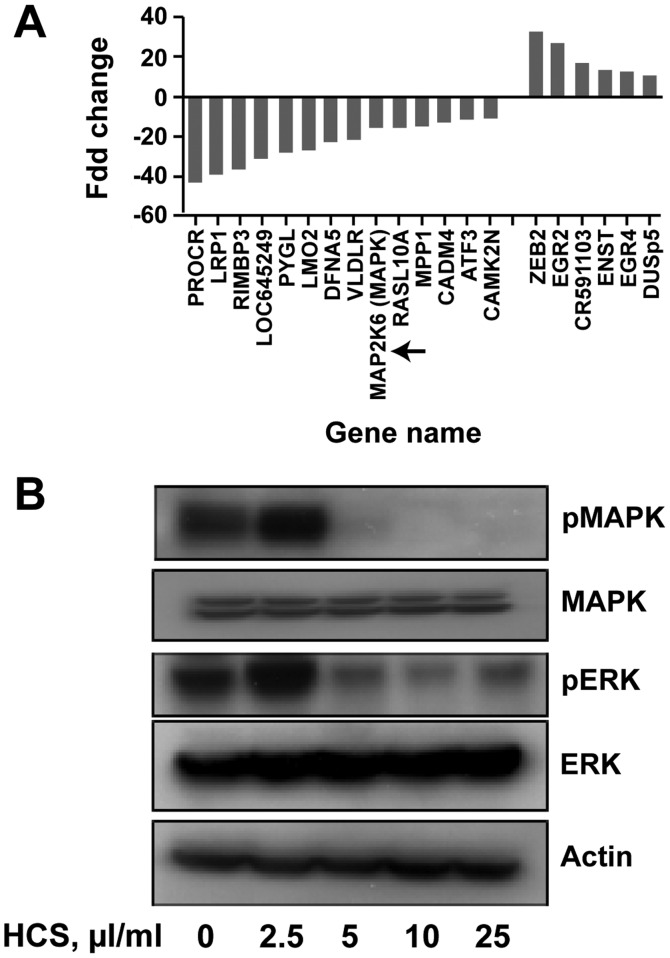
Figure 5.
Gene expression analysis and assessment of signaling pathways perturbed by HCS in Ramos cells. Cells were treated with 25 μl/ml of HCS for 24 h and gene expression analysis was performed at the MD Anderson microarray core facility, using an Affymetrix chip. (A) Genes were up- and downregulated ~10–40-fold in HCS treated Ramos cells relative to vehicle treated cells. (B) The expression of MAP kinase pathway proteins in Ramos cells treated with HCS at the indicated concentrations for 24 h. Cell lysates were then subjected to western blot analysis for total and phosphorylated levels of MAPK and ERK proteins.

