
Figure 2.
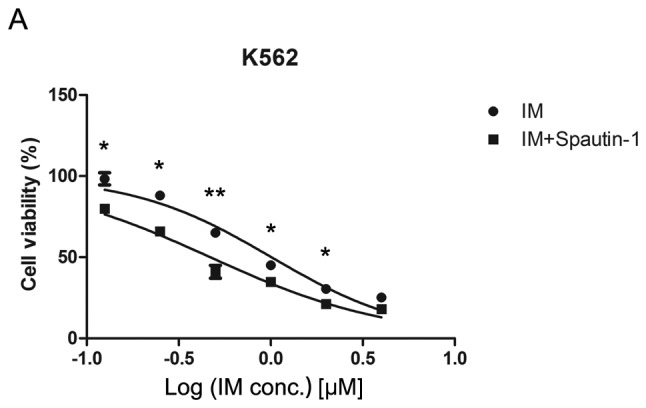
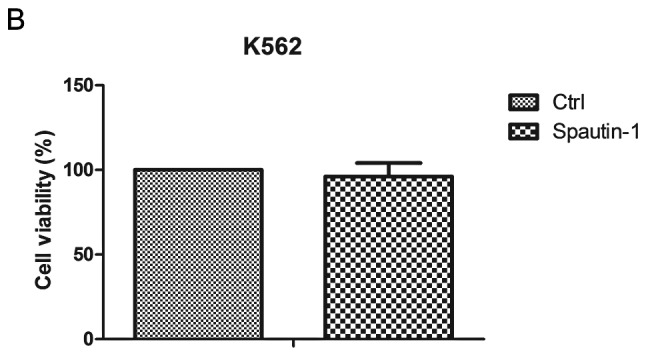

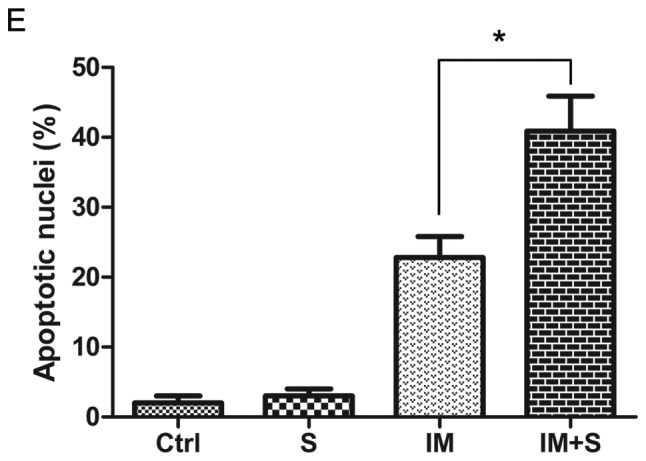
Spautin-1 enhances IM-induced cytotoxicity in K562 cells. (A) Cells were treated with varying concentrations of IM for 48 h in the presence or absence of spautin-1 (10 μM). Cell viability was determined by CCK-8 assay. Data are expressed as the mean ± SD, and analyzed by Student’s t-test (*P<0.05 and **P<0.01). (B) Cell viability of spautin-1 alone (10 μM) group compared with control group after 48-h incubation. Cell viability was determined by CCK-8 assay. After treatment with 500 nM IM or DMSO for 12 h, spautin-1 (10 μM) or DMSO was added to K562 medium for further 36 h. (C) Changes in cellular morphology were examined by a light microscope (×200). (D) Cells were stained with Hoechst 33258 fluorescent stain. Changes were observed under a fluorescence microscope (×400). Arrows point to the apoptotic nuclei. (E) Apoptotic nuclei were quantified by counting 102 cells on three separate fields for each condition. Results from three independent experiments are shown. Data are expressed as mean ± SD (*P≤0.05).