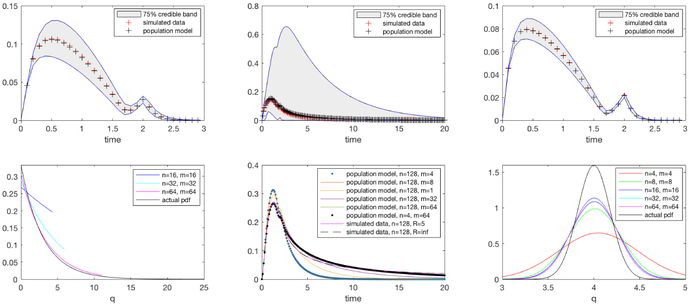
Figure 6.1:
Top row, starting from the left: Data, converged estimated population model and 75% credible band for (a) Example 6.1 Truncated uniform distribution; (b) Example 6.2 Truncated exponential distribution; (c) Example 6.3 Truncated normal distribution. Bottom row, starting from the left: (d) Example 6.2 Converged pdfs for truncated exponential distribution; (e) Example 6.2 Data and Estimated population model for various values of R, n and m; (f) Example 6.3 Converged pdfs for truncated normal distribution.

