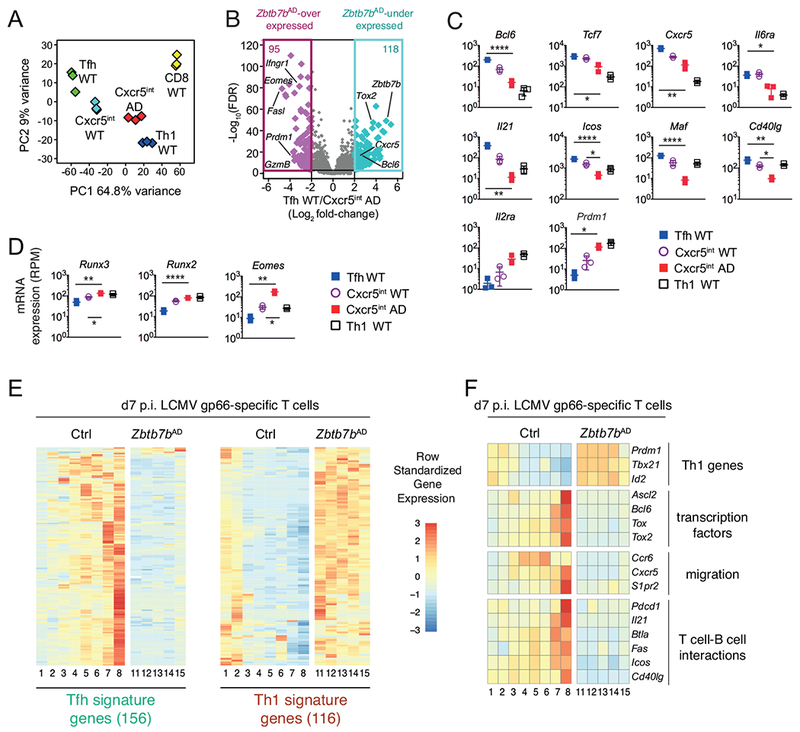
Fig. 3. Thpok is required to establish the Tfh transcriptome.

(A-D) RNAseq analysis of gene expression at d7 p.i. with LCMV, on cell populations purified as in Fig. S2A. (A) Principal Component Analysis (PCA) displays cell subsets according to the first two components. Each diamond represents an individual RNAseq sample. (B) Volcano plot shows differential gene expression (Log2 fold-change, x-axis) between wild-type Tfh and Zbtb7bAD Cxcr5int cells vs. adjusted P-value (1/FDR, Log10 scale, y-axis). Each diamond represents one gene. Genes with a greater than 4-fold expression change are color-highlighted, and their number indicated at the top of each box; relevant genes are indicated. (C, D) mRNA expression (reads per million, RPM) in wild-type Tfh (blue-filled squares), wild-type Cxcr5int (open circles) Zbtb7bAD Cxcr5nt (red-filled squares) and wild-type Th1 (open squares) cells. Each symbol represents a distinct sample, bars show average ± SD. (C, D): P values were less than 0.05 (*), 0.005 (**), 0.0005 (****) (Student t-test, corrected for multiple testing). (E, F) Heatmaps show row-standardized gene expression in independently defined clusters of Zbtb7bAD or control I-Ab-gp66+ T cells analyzed by scRNAseq on d7 p.i. with LCMV. (E) Heatmap is shown for genes included in Tfh and Th1 signature defined as follows from RNAseq data schematized in (A): Log2 fold-change (wild-type Tfh vs. Th1) >2 (Tfh signature) or <0.5 (Th1 signature), FDR<0.001. (F) Heatmap is shown for indicated genes involved in Tfh differentiation. Please see also Figure S2.
