
Fig. 5. Identification of a Thpok-binding and -responsive region in Bcl6.
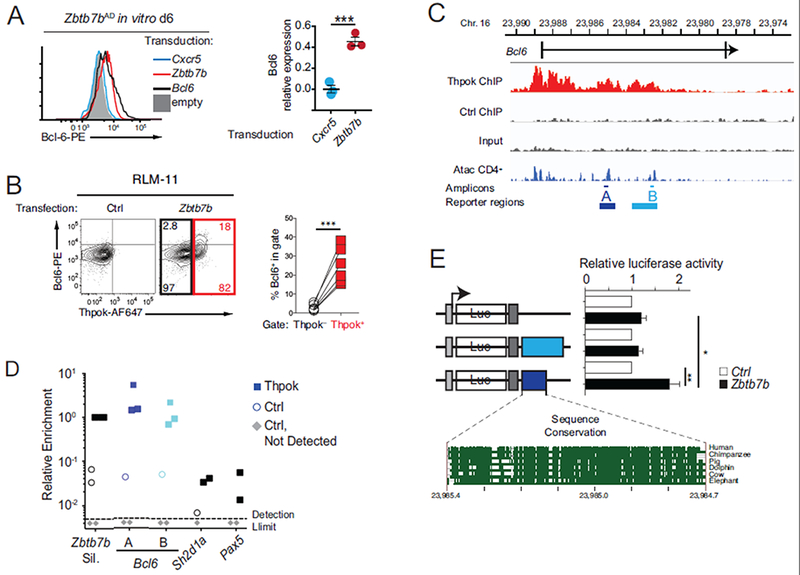
(A) Intra-cellular Bcl6 expression in in vitro cultured Zbtb7bAD Smarta T cells 6 days after transduction with the indicated retroviral vector. Histogram (left) is representative of 3 experiments summarized in graph (right), where Bcl6 expression (MFI) in indicated transduced cells is expressed relative to that in Bcl6-transduced cells, set to 1. (B) Left, intra-cellular expression of Thpok and Bcl6 in RLM-11 cells transfected with a Zbtb7b (right) or control (left) vector; numbers in right plot indicate the percentage of cells in quadrant, relative to the number of cells in black- or red-colored box. Graph (right) shows the percentage of Bcl6-expressing cells as defined on contour plot. Each symbol represents an individual transfection (n=6 in the experiment shown). Data is representative of 5 independent experiments. (C) Schematic of the Bcl6 locus shows the first two exons (bars) surrounding the first intron; bottom track show Immgen AtacSeq peaks in naïve CD4+ T cells (http://rstats.immgen.org/Chromatin/chromatin.html). Middle tracks show ChIPseq on the Bcl6 locus in activated CD4+ T cells from Zbtb7bBio/+ Rosa26BirA+ (Thpok), or Zbtb7b+/+ Rosa26BirA+ (Ctrl) mice, and input from Zbtb7bBio/+ Rosa26BirA+ cells. A and B designate PCR amplicons used in ChIP PCR (D, thin lines) and regions analyzed in reporter assays (E, bold lines). (D) Relative enrichment of amplicons A and B and negative controls (Sh2dla and Pax5) in streptavidin pull-downs of chromatin from Thpok-bio (filled squares) or control (Thy1.1-expressing, empty circles) retrovirally transduced cells. Data is expressed relative to Zbtb7b silencer signal in Thpok-bio cells, set to 1 in each experiment; grey diamonds indicate samples (all from control-transduced cells) with no detectable qPCR signal. Each symbol represents a separate determination and the figure summarizes four distinct experiments. (E) Bar graph (right) shows luciferase (Luc) activity in RLM-11 cells co-transfected with either a Zbtb7b (black bars) or control (open bars) expression vector and reporter schematized on the left. For each reporter, data is expressed relative to the activity in control-transfected cells, set to 1. Bottom graph depicts sequence conservation within region A (https://genome.ucsc.edu/). Grey boxes indicate the SV40 promoter and polyadenylation signals. Data is from 6 experiments. (B, E) ***P<0.0001, **P<0.001, *P<0.05 (Student t-test).