
Fig. 7. Thpok targets Bcl6 and Maf to promote Tfh cell differentiation.
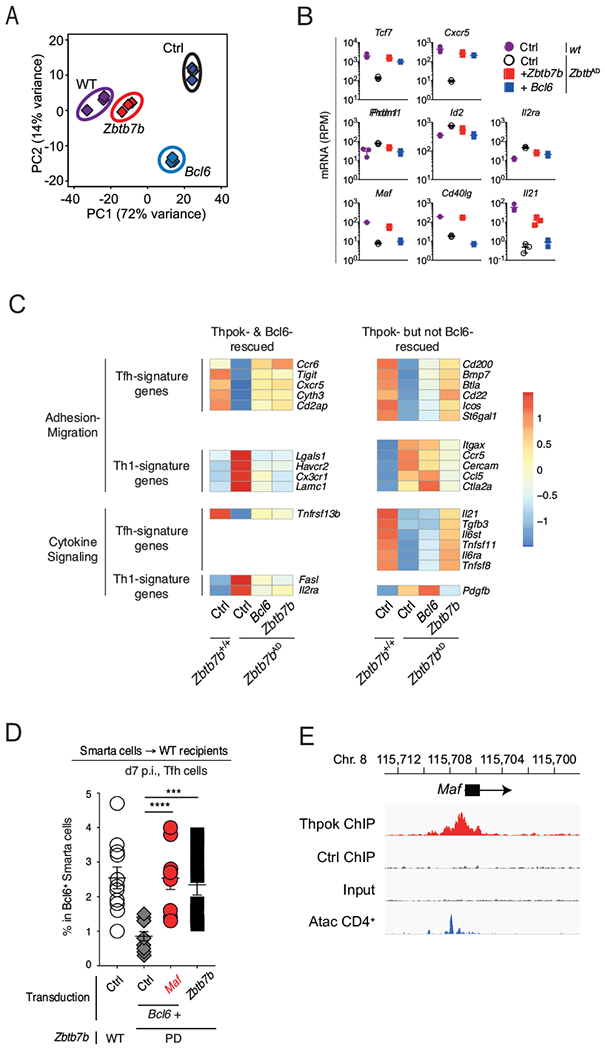
(A-C) RNAseq analyses on adoptively transferred cells prepared and purified as in Figs. 6A and S5A. (A) PCA of RNAseq data displays cell subsets according to the first two components. Each diamond represents an individual RNAseq sample derived from wild-type (wt) or Zbtb7bAD cells transduced with a control retrovirus (Ctrl), or “add-back” Zbtb7bAD cells transduced with a Bcl6 or Zbtb7b retrovirus. (B) mRNA expression (reads per million, RPM) of indicated genes in cell subsets defined in (A). Each symbol represents a distinct biological replicate, bars show average ± SD. (C) Heatmap shows row-standardized (z-scores of average RPM values, scale on the right) mRNA expression on indicated genes. Gene expression values are from the set of population RNAseq shown in (A) and are shown for Smarta cells that were either wild-type (+/+) or Zbtb7bAD (AD) and had been transduced with a control retrovirus (Ctrl), or a Bcl6 or a Zbtb7b retroviral expression vector (Bcl6 and Thpok “add-back”, right two columns). Top and bottom panels show genes involved in adhesion-migration, or in cytokine signaling, respectively. Genes shown are part of Tfh and Th1 signatures defined in Fig. 3E and additionally selected for Thpok-dependent expression in “add-back” experiments (>2-fold differential expression between Ctrl-transduced Zbtb7b+/+ and Zbtb7b AD samples, FDR<0.001). (D) Percentage of Tfh cells among Zbtb7bPD Smarta cells transduced with the indicated retroviral combinations, adoptively transferred into wild-type recipients, and further processed as in (A). Data is shown on gated Bcl6-expressing cells and summarizes 4 similar experiments with 11 WT Ctrl and 9-12 mice for each Zbtb7bPD transduction; each symbol represents an individual mouse. ****P< 0.0001, ***P<0.0005 (Student t-test). (E) Thpok or control ChIPseq traces on the Maf locus, displayed as in Fig. 5C. Please see also Figure S5.