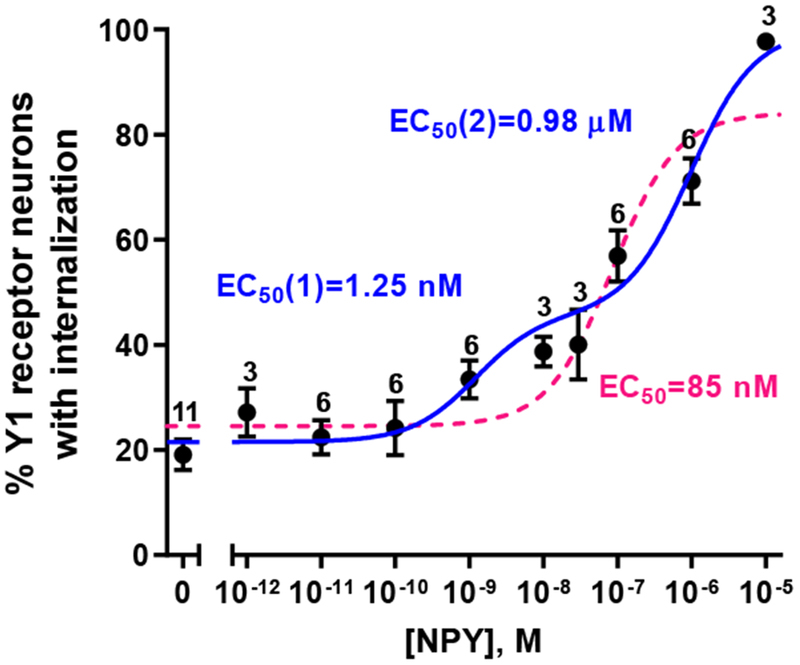
Figure 3 -. Concentration-response curve for neuropeptide Y (NPY) to induce Y1 receptor internalization.

Rat spinal cord slices were incubated at 35 °C for 10 min in aCSF alone (0 M) or with NPY at the concentrations indicated. Slices were fixed and immunofluorescence with the Y1 receptor antibody was used to measure Y1 receptor internalization. Y1 receptor neurons were counted in laminae I and II. Numbers are the number of slices at each concentration of NPY. Non-linear regression fitting of a biphasic dose-response function to the data (98 % probability, Akaike’s Information Criterion): Log EC50(1) = −8.90 ± 0.35 (EC50 = 1.25 nM), Log EC50(2) = −6.01 ± 0.23 (EC50 = 0.98 μM), Frac = 0.31 ± 0.06, top = 100 % (hit the constraint top ≤ 100 %), bottom = 21.5 ± 2.1 %, R2 = 0.844. The dotted curve represents fitting to a monophasic concentration-response curve.
