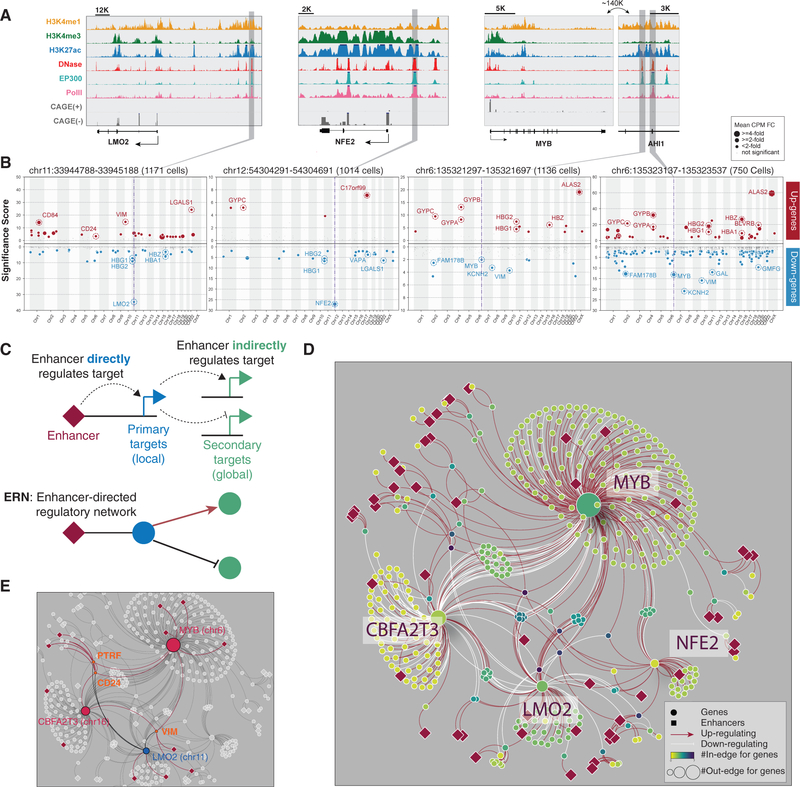
Figure 3. Global Analysis Reveals Enhancer-Driven Regulatory Networks (ERNs).
(A) Genome Browser snapshots illustrate the local epigenetic features of several targeted enhancers near LMO2, NFE2, and MYB/AHI1.
(B) Similar to Figure 1G. In addition, the dot size represents fold change.
(C) An enhancer-driven regulatory network (ERN) consists of an enhancer’s primary (direct) targets and its secondary (indirect) targets.
(D) An example ERN.
(E) ERN sub-network highlighting PTRF, CD24, and VIM as common secondary targets of enhancers across the genome.

