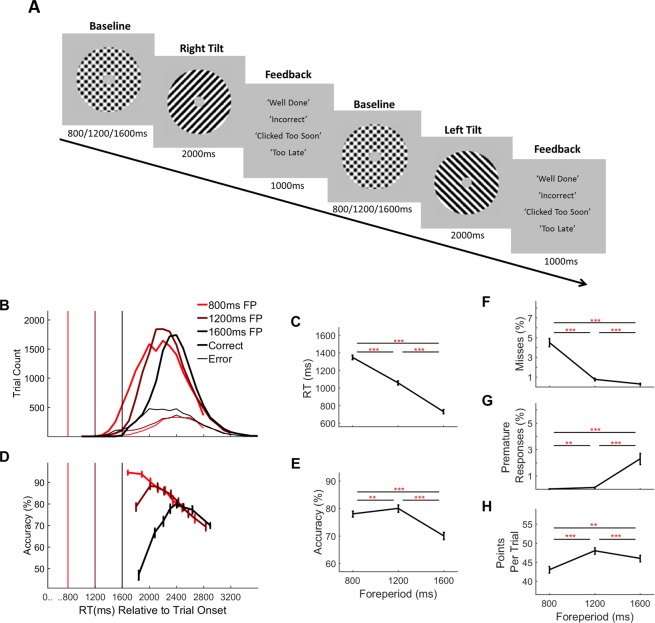
Figure 1. Two-alternative forced choice contrast discrimination task and behaviour separated by foreperiod (fp) duration.
(A) Task Schematic: Each trial commenced with the presentation of two overlaid left- and right-tilted gratings (45° relative to the vertical midline) within a circular aperture against a grey background. At baseline the gratings were each presented at 50% contrast. After an initial foreperiod, the duration of which varied unpredictably from trial-to-trial (800 ms/1200 ms/1600 ms), one grating stepped up in contrast by an individually predetermined amount (M = 5.5%, SD = 1.35%, range = 2–7%) while the other stepped down by a corresponding amount. Schematic depicts a right-tilted target followed by a left-tilted target with 50% contrast changes for illustration purposes only. Feedback was presented at the end of each trial. (B) RT distributions separated by foreperiod and response accuracy. Vertical line markers indicate the times of the contrast change. (C) Mean RT (corrects and errors pooled) separated by foreperiod duration. (D) Conditional accuracy functions showing accuracy as a function of RT separated by foreperiod. Vertical line markers indicate the times of the contrast change. Mean accuracy (E), missed response rate (F), premature response rate (G) and points earned per trial (H), separated by foreperiod duration. Error bars represent standard error of the mean. Asterisks’ indicate statistical significance of post-hoc comparisons: **=p < 0.017, ***=p < 0.001; Bonferroni corrected critical p-value=0.017.


