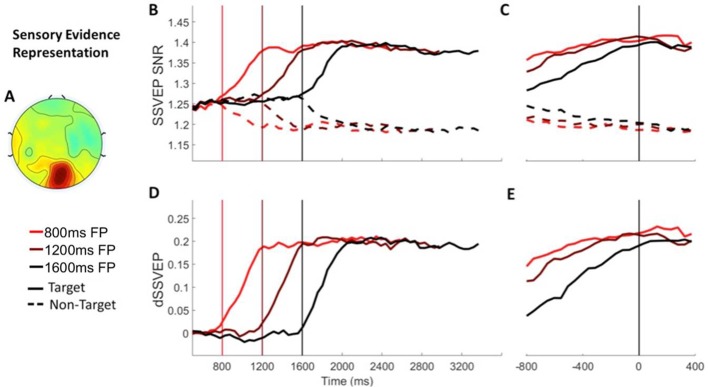
Figure 2. Sensory evidence representation (SSVEP) Signals separated by foreperiod (FP).
(A) The topography of the d-SSVEP measured prior to response was maximal over the occipital cortex (Oz). (B) Stimulus-aligned target and non-target SSVEP signals separated according to foreperiod duration, plotted relative to the onset of the stimulus. Vertical line markers at 800/1200/1600 ms indicate the times of the contrast change. (C) Response-aligned target and non-target SSVEP signals separated according to foreperiod duration. The vertical line marker at 0 ms denotes the time of response. (D) Stimulus-aligned d-SSVEP signal separated according to foreperiod duration, plotted relative to the onset of the stimulus. Vertical line markers at 800/1200/1600 ms indicate the times of the contrast change. (E) Response-aligned d-SSVEP signal separated according to foreperiod duration. The vertical line marker at 0 ms denotes the time of response.

