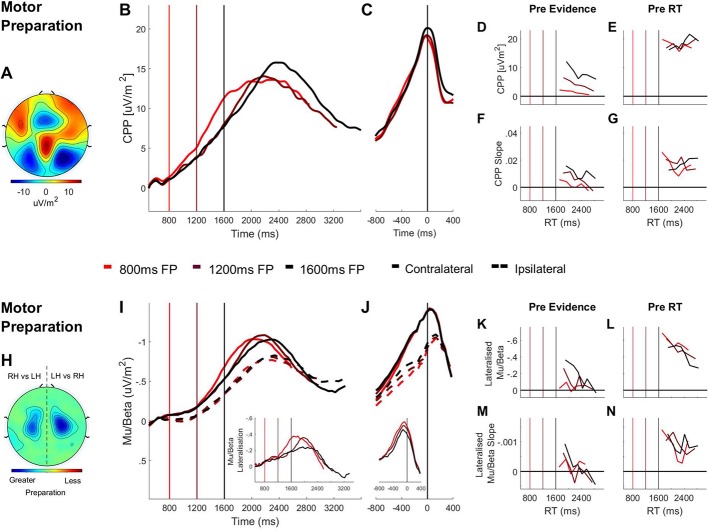
Figure 3. Domain-general (CPP) and effector-selective (Mu/Beta 10–30 Hz).
Decision Signals Separated by Foreperiod (FP) in the Contrast Discrimination Task. (A) Topography of the ERP signal measured prior to response (−150 ms to −50 ms) showing a positive going centroparietal component maximal over Pz. (B) Stimulus-aligned CPP separated by foreperiod duration, plotted relative to the onset of the overlaid gratings stimulus. Vertical line markers at 800/1200/1600 ms indicate the times of the contrast change across the three levels of foreperiod duration. (C) Response-aligned CPP separated by foreperiod duration. The vertical line marker at 0 ms denotes the time of response. (D) CPP amplitude measured at contrast change (−50 ms to 50 ms) and (E) at response (−150 ms to −50 ms) plotted as a function of RT separately for each foreperiod. (F) Pre-evidence CPP build-up rate (−250 ms to 50 ms) and (G) pre-response CPP build-up rate (−500 ms to −200 ms), plotted as a function of RT separately for each foreperiod. (H) Topography of lateralised Mu/Beta band (10–30 Hz) activity measured prior to response (−150 ms to −50 ms) calculated separately for each hemisphere by subtracting ipsilateral from contralateral hand responses (LH = left hand; RH = right hand).The topography shows stronger lateralisation over each hemisphere when preparing a contralateral response. (I) Stimulus-aligned contralateral and ipsilateral Mu/Beta waveforms, separated by foreperiod duration, plotted relative to the onset of the overlaid gratings. Vertical line markers at 800/1200/1600 ms denote the times of the contrast change across the three levels of foreperiod duration. Insert: stimulus-aligned Mu/Beta lateralisation (contralateral-ipsilateral) traces. (J) Response-aligned contralateral and ipsilateral Mu/Beta waveforms, separated by foreperiod duration with a vertical line marker at 0 ms denoting the time of response. Insert: response-aligned Mu/Beta lateralisation (contralateral-ipsilateral) traces. (K) Mu/beta lateralisation at contrast change (−50 to 50 ms) and (L) response (−150 ms to −50 ms), plotted as a function of RT separately for each foreperiod. (M) Pre-evidence Mu/Beta lateralisation slope (−250 ms to 50 ms) and (N) pre-response Mu/Beta lateralisation slope (−500 ms to −200 ms) plotted as a function of RT separately for each foreperiod.
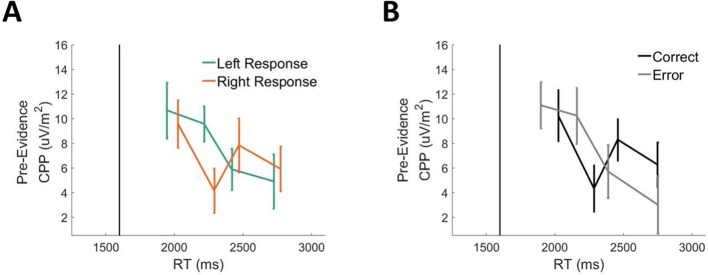
Figure 3—figure supplement 1. Pre-evidence stimulus-aligned CPP waveforms on long (1600ms).
