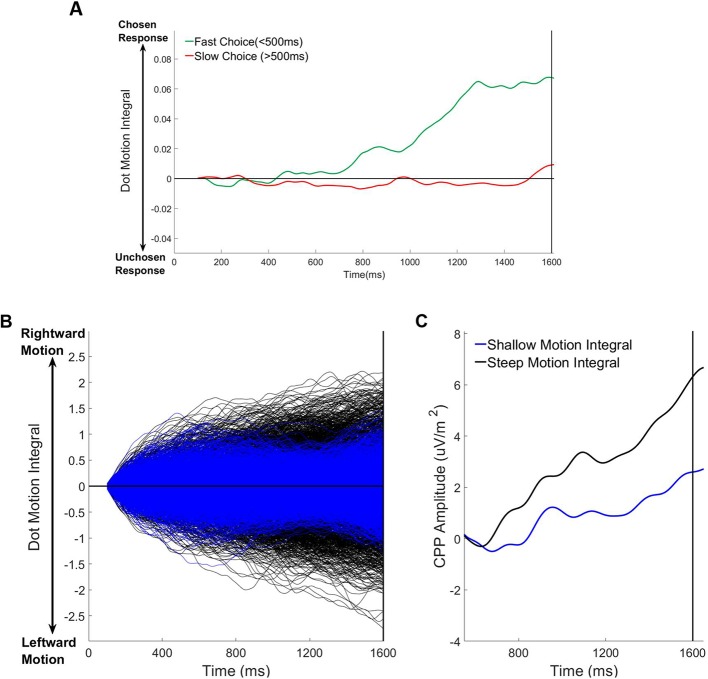
Figure 6. Relationship between pre-evidence cumulative dot motion energy, choice and pre-evidence cpp build-up (1600ms foreperiod trials only).
(A) Average cumulative dot motion integral (measured between 100–1600 ms) separated for fast (RT <500 ms) and slow (RT >500 ms) responses. (B) Single trial cumulative dot motion integral traces separated according to the slope of the pre-evidence dot motion integral (100–1600 ms). (C) Grand average stimulus-aligned CPP separated according to the slope of the the pre-evidence dot motion integral.

