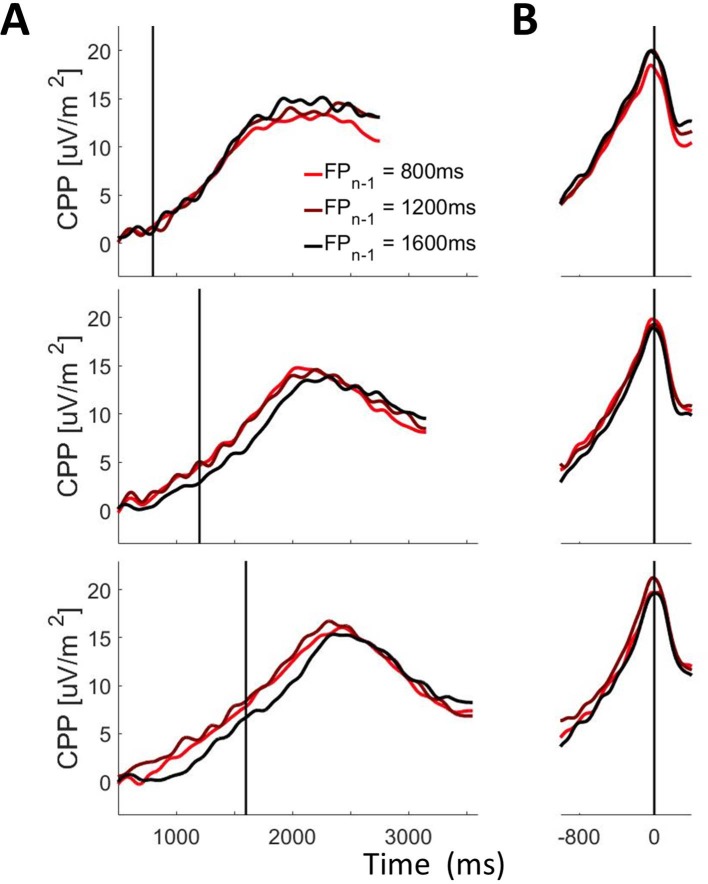
Figure 8. CPP as a function of foreperiodn and foreperiodn-1.
(A) Stimulus-aligned and (B) Response-aligned CPP waveforms separated according to foreperiodn (Top Panel: 800 ms; Middle Panel 1200 ms; Bottom Panel 1600ms) and foreperiodn-1. Shaded grey bars correspond to the pre-evidence (A) and pre-response (B) measurement windows. Solid black vertical lines mark the time of evidence onset (A) and response (B).

