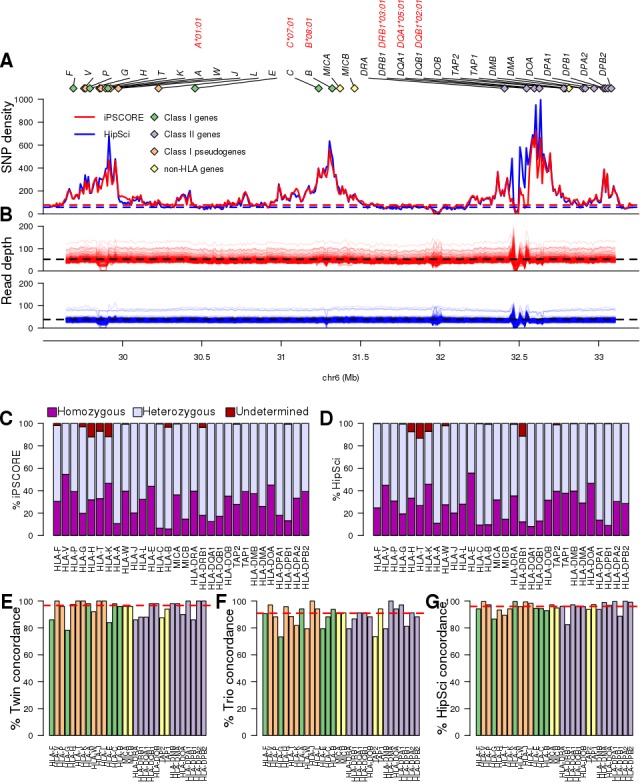
Figure 2. WGS coverage in MHC region and HLA types.
(A) SNP density distribution in consecutive 10 kb bins in the HLA region (chr6: 29690551, 33102442). The dashed lines represent the chromosome-wide SNP density in the iPSCORE (blue) and HipSci (red) WGS samples. The 30 HLA genes analysed in this study are represented by diamonds with green representing HLA Class I, purple HLA Class I pseudogenes, orange HLA Class II and yellow non-HLA genes. The four-digit HLA types for the six genes composing the 8.1AH are shown in red. (B) Read depth coverage of the HLA region for the iPSCORE WGS samples (top, red) and the HipSci WGS samples (bottom, blue) was calculated using consecutive 10 kb bins. Each line represents a single WGS sample, the black dashed lines represent the average coverage for the iPSCORE WGS samples (52X) and the HipSci WGS samples (38X). (C, D) Fraction of the 273 iPSCORE (C) and 377 HipSci (D) WGS samples with homozygous, heterozygous and undetermined alleles for each of the 30 HLA genes. For each sample, if one of the two alleles for an HLA gene was undetermined, we considered the HLA genotype as ‘undetermined’. (E) Twin concordance (iPSCORE: 25 monozygotic twin pairs), (F) Mendelian inheritance concordance (iPSCORE: 17 trios) and (G) Fibroblast-iPSC concordance (HipSci: 231 fibroblast-iPSC pairs) of HLA types at eight-digit resolution. Genes were sorted based on their genomic position and colored according to their class, as shown in panel A. The red dashed line represents the median across all genes.

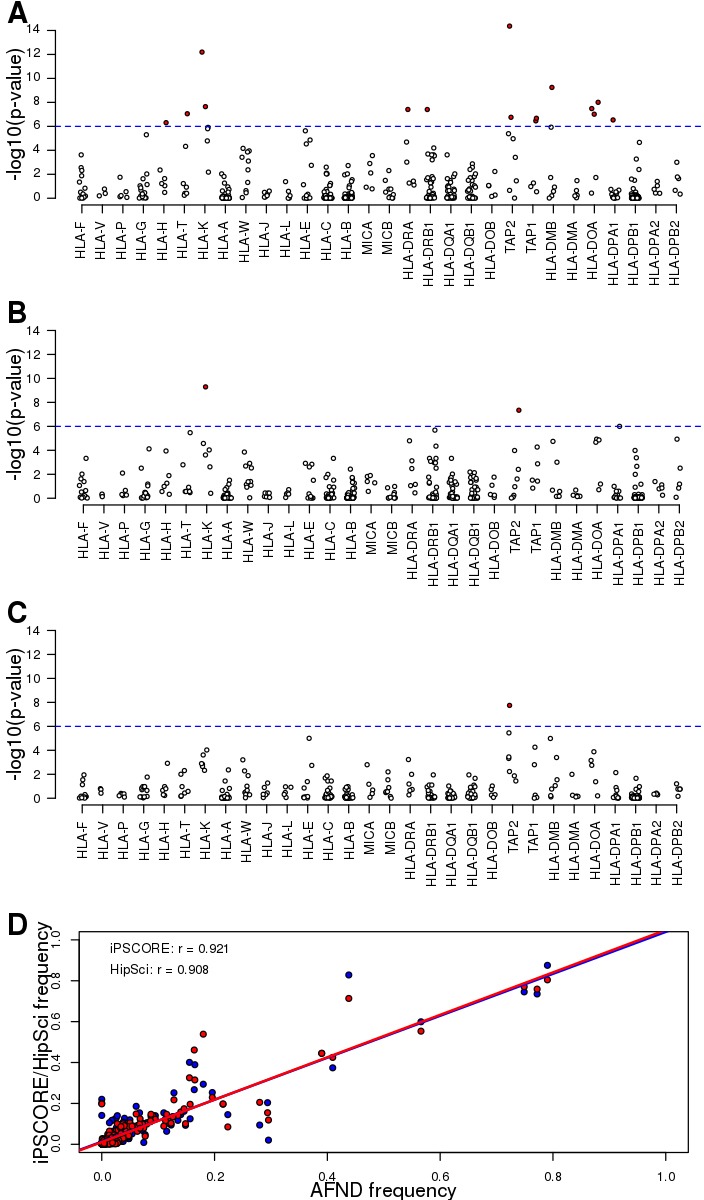
Figure 2—figure supplement 1. Allele frequencies of predicted HLA types.

