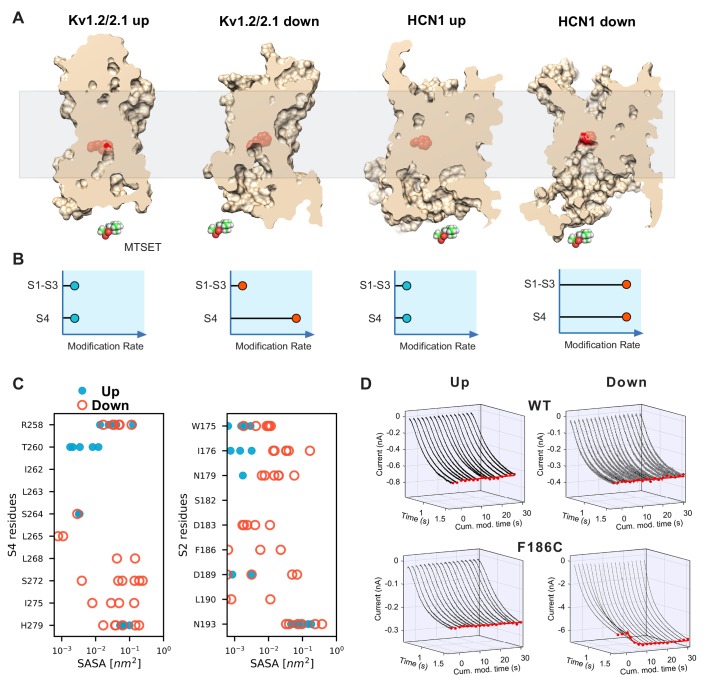
Figure 2. State-dependent accessibility of residues in S2 and S4 segments of HCN channel.
(A) Accessibility of the S2 charge transfer center (Phe residue) in representative molecular models of the activated and resting states Kv1.2/2.1 VSDs and the resting and activated states HCN1 VSDs extracted from molecular simulations. The charge transfer center is only accessible from the intracellular medium in the activated (Down) state of HCN1. A cutaway through the VSD is represented as a slightly transparent light brown surface; the charge transfer center (Phe residue) is represented as red spheres. (B) Predicted accessibility to internally applied polar cysteine modifying reagents. Accessibility to S4 cysteines will increase in the Down state compared to the Up state for both models as has been shown previously. The S2 cysteine at or proximal to the charge transfer center is expected to show very little modification in both Up and Down states in the canonical model. However, if the helix breaks and opens a large cavity in the Down state, the cysteine at the charge transfer center will become accessible in a state-dependent fashion. (C) Solvent accessibility estimates of S4 (left) and S2 (right) residues for both up and down state models of HCN1. The accessibility of each residue is estimated for the six voltage sensors that underwent activation and shown as one symbol each (closed blue circles for the resting Up state, open orange circles for the activated Down state). (D) State-dependent accessibility of the charge transfer center of hyperpolarization-activated ion channel. Wild type spHCN channel does not react with MTSET under hyperpolarized or depolarized condition (top two panels). Substitution of the charge transfer center, F186C, on the other hand, shows state-dependent reactivity with MTSET (bottom two panels). The rate of reactivity in the activated Down state is 440 ± 30 M−1s−1 versus 7.5 ± 0.3 in the resting Up state.


