. 2019 Nov 27;8:e53400. doi: 10.7554/eLife.53400

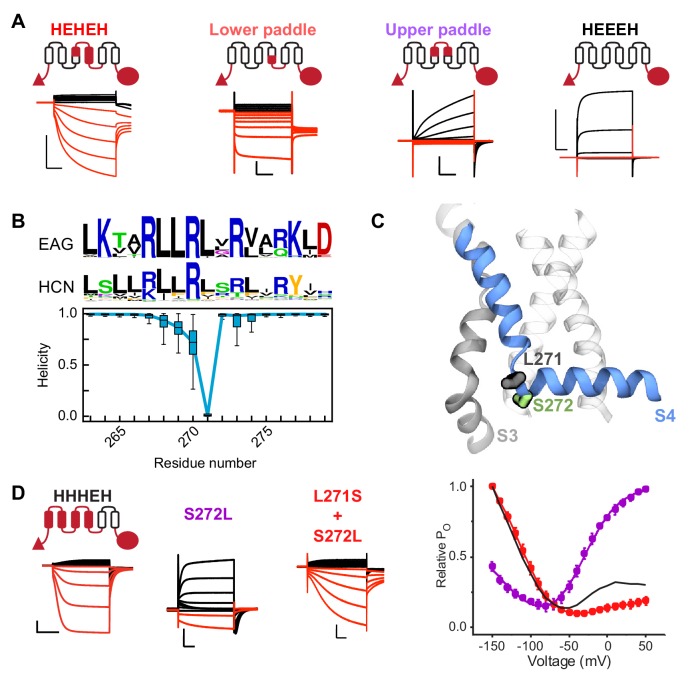
Figure 3. A conserved serine residue (S272) located in the lower half of the S4 segment is critical for hyperpolarization-dependent gating.

(A) Cartoon representations and representative current traces for chimeras with varying contributions of the HCN1 S4 helix. Black traces represent current responses to depolarizing pulses whereas are red ones depict current responses elicited by hyperpolarizing potential pulses. Test pulses range from −150 mV to 50 mV from a holding potential of 0 mV (lower paddle), −50 mV (HEHEH), or −90 mV (HEEEH and upper paddle). Scale bars show 5 µA (vertical) and 200 ms (horizontal). Color coding and scale bars are same throughout the figure. (B) Top: Consensus sequences from multiple sequence alignments for S4 helix of EAG and HCN families shown as sequence logos (Crooks et al., 2004). The height of each residue is proportional to its frequency, while the height of the overall stack of residues is inversely proportional to Shannon entropy. Bottom: Helicity of S4 helix plotted as a function of residue position in the activated state of HCN1 from simulations. The box plot shows the median, 25–75% (box), 1–99% (bars) of the data collected from the six voltage sensors that underwent activation. (C) Structure of a representative activated state model highlighting the position of key residues near the bend (L271 and S272 in gray and green sticks, respectively). (D) Left: Representative current traces from the bipolar chimera HHHEH and mutants of this background near the site of the S4 bending. Test pulses range from −150 mV to 50 mV from a holding potential of −50 mV (HHHEH and L271S+S272L) or −100 mV (S272L). Right: Relative PO vs. voltage curves for the mutants. Error bars represent standard deviation n = 4 (S272L), 4 (S271S+S272L) from independent measurement.

Figure 3.

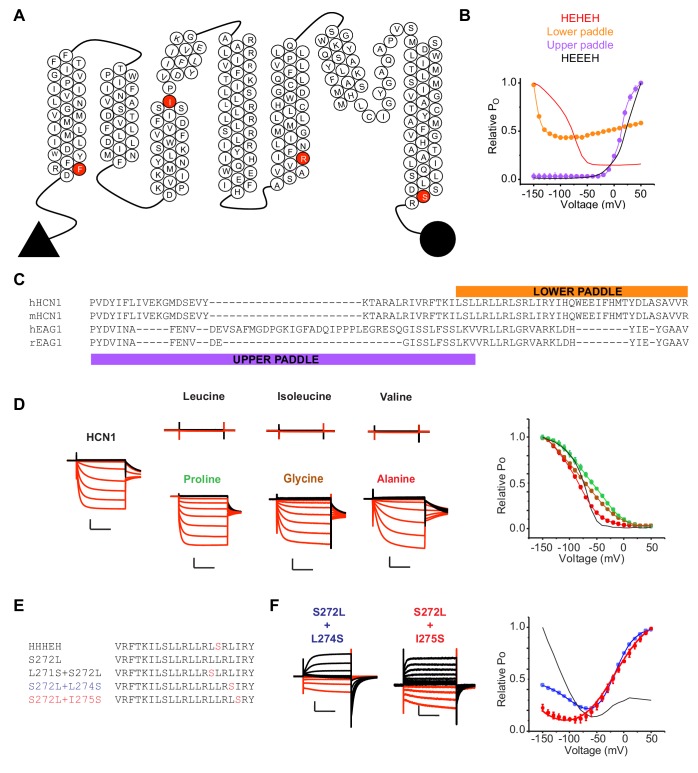
Figure 3—figure supplement 1. Probing the role of HCN S4 in hyperpolarization dependent gating.

Figure 3—figure supplement 1.

(A) Snake plot of the mouse HCN1 (mHCN1) sequence showing the various breakpoints used for designing the chimeras. (B) Relative PO vs. voltage curves for the HEHEH and HEEEH chimeras, and the lower and upper paddle mutants. The parent HEHEH and HEEEH are shown as lines for clarity. Error bars represent standard deviation. (C) Sequence alignment of hHCN1, mHCN1, hEAG1 and rEAG1 showing the sequence used in the lower and upper paddle chimeras. (D) WT HCN1 with different mutations at S272 position. Black current traces are elicted by pulses to depolarizing potentials whereas red current traces are elicted by pulses to hyperpolarizing potentials. Scale bars represent 5 µA (vertical) and 200 ms (horizontal). Color coding and scale bars are same throughout the figure. Test pulses range from −150 mV to 50 mV from a holding potential of −10 mV. Right: Relative PO vs. voltage curves for the mutants presented on the left with WT HCN1 shown as a line for clarity. Error bars represent Standard Deviation from n = 4 (Glycine and Alanine), 5 (WT HCN1), 6 (Proline) from independent measurements. (E) Sequences of the S4 segment of the HHHEH chimera and its mutants S272L, L271S/S272L, S272L/L274S and S272L/I275S. (F) Representative current traces for the HHHEH chimera and its mutants S272L/L274S and S272L/I275S. Test pulses range from −150 mV to 50 mV from a holding potential of −80 mV. Right: Relative PO vs. voltage curves for the mutants presented. Error bars represent Standard Deviation from n = 4 (S272L/S274S), 5 (S272L/I275S) from independent measurements.
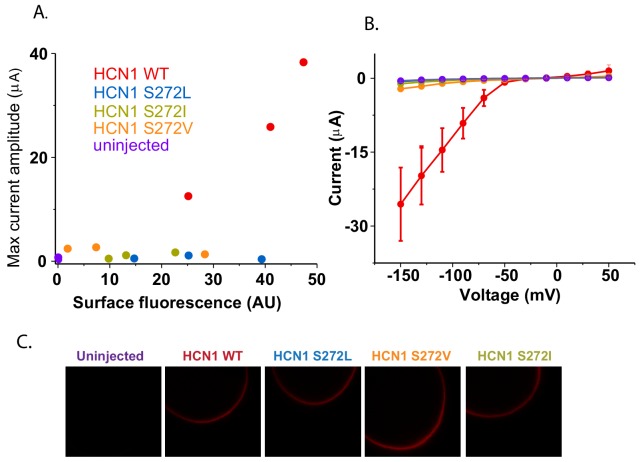
Figure 3—figure supplement 2. Surface trafficking of HCN1 and hydrophobic mutants at S272.

Figure 3—figure supplement 2.

(A) Correlation of maximum current amplitude with mCherry surface fluorescence for HCN1 WT, hydrophobic mutants at S272 and uninjected oocytes. Each point represents the maximal current amplitude and integrated surface fluorescence of one oocyte. (B) Current-voltage relationships for the oocytes tested in (A) shown with the same color scheme. Error bars represent SEM for three oocytes (or two oocytes for uninjected). (C) Representative confocal micrographs of oocytes used in previous panels.