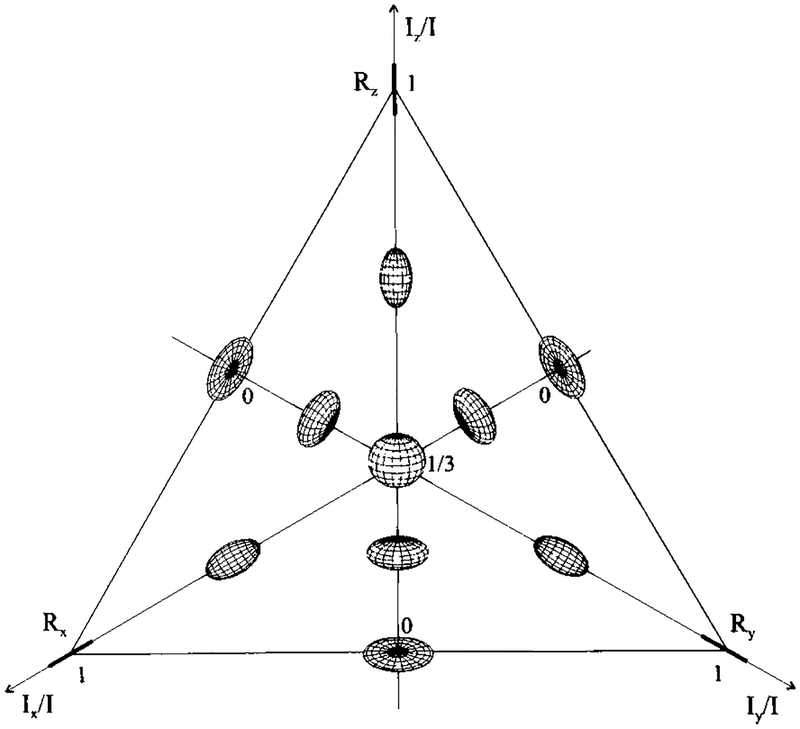
FIG. 5.
Approximate polar plots of the emission fields corresponding to the particular areas of the triangle of anisotropy. The relative intensities, Ix /I, Iy /I, and Iz /I, vary along the respective medians of the triangle from zero to unity. The centroid of the triangle corresponds to Ix /I=Iy /I=Iz /I=1/3 and to the spherically symmetrical emission field, whereas the vertices of the triangle correspond to the emission fields which are rodlike along the respective axes of the coordinate system (x,y,z).

