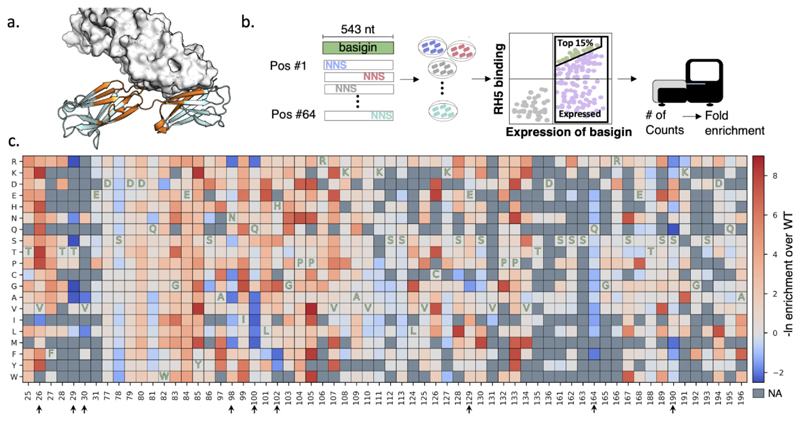
Figure 1. Mutational scanning of the soluble fragment of human basigin.
(a) Basigin (cartoon) and RH5 (surface) structure (PDB entry: 4u0q). Positions that were subjected to deep mutational scanning are colored in orange. (b) Schematic representation of the experimental method. 64 positions were selected for single point saturation mutagenesis. The PCR products were transformed into yeast and the top 15% and expressed population was selected for deep mutational scanning. The fold enrichment values were calculated for each point mutation. (c) The deep mutational scanning map shows that most positions do not increase binding affinity and mutations in only 9 of 64 positions improved affinity. Mutations in blue improved binding affinity; mutations in red were deleterious and ones in gray contained insufficient data (NA) for statistical analysis. One-letter codes indicate wild type amino acid identities at each position. Positions that increased the binding affinity are marked by arrows.

