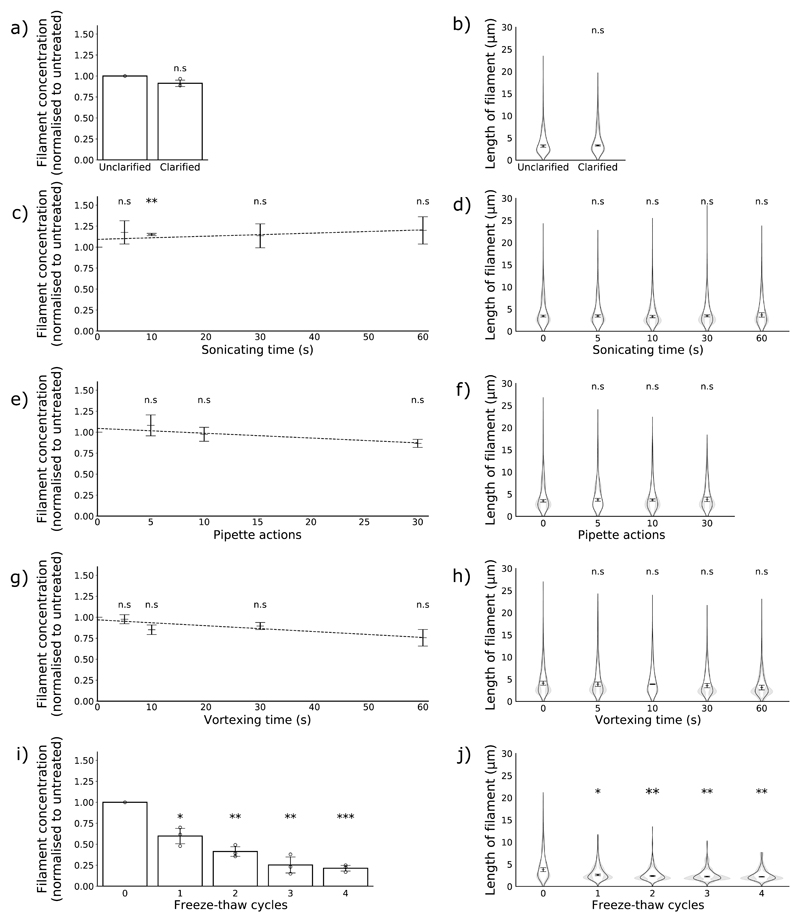
Figure 2. The effects of common laboratory manipulations on filaments.
Concentration and length distributions of filaments in populations treated with clarification by low-speed centrifugation (a, b) and with increasing exposure to sonication (c,d), pipetting (e,f), vortexing (g,h) and freezing (i,j). (n = 3). Concentration data are normalised to the untreated sample and the means and s.d. are shown; comparisons to untreated were made by two-tailed single-sample t-test: n.s p > 0.05, * p < 0.05, ** p < 0.01, *** p < 0.001. Polynomial trend lines were fitted by the least squares method. Filament length distributions are shown as frequency distributions (mean, with 95% CI in grey) and distributions of the median filament length (mean position indicated as a line, s.d. as whiskers). Population medians were compared to the untreated sample by two-tailed Student’s t-tests: * p < 0.05, ** p < 0.01, *** p < 0.001.

