Figure 3.

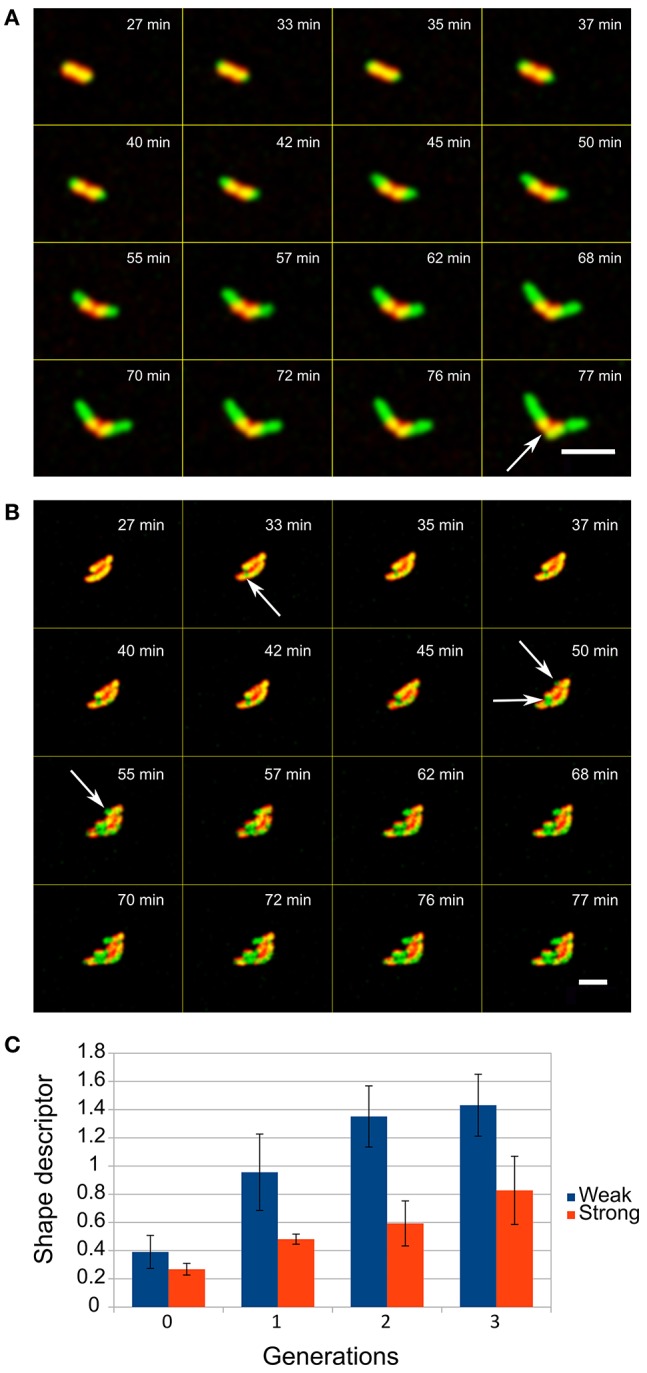
Escape of E. coli cells from the LBL layers when entrapped in (A) low and (B) high number of layers (red is LBL shell, green is GFP producing cells, overlap regions are yellowish), scale bar = 5 μm. The entrapment of cells in different numbers of layers (up to 6 layers is weak and a shell with 8 layers is a strong shell) determines how compact microcolonies can be formed. (C) The shape descriptor is an estimate parameter of circularity where zero values represent an optimal round shape (see Methods). Two-tailed t-test of encapsulated and control cells comparison showed significant difference (P < 0.05) in the shape descriptor from the first generation onward.
