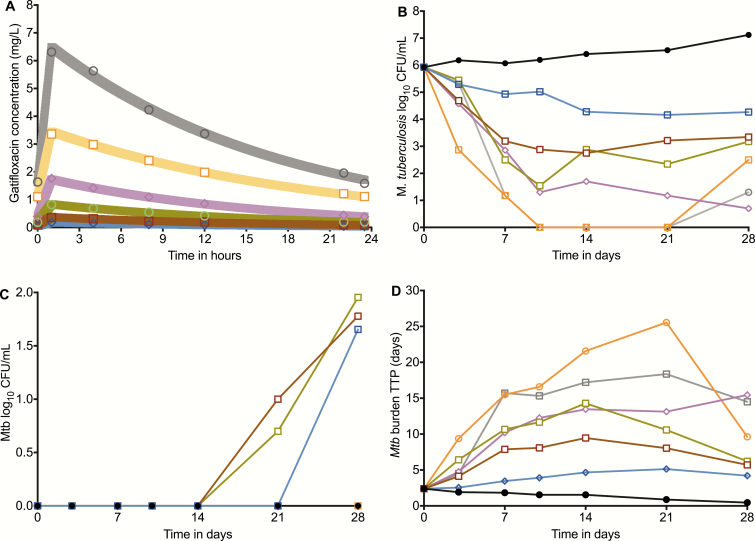
Figure 2.
Gatifloxacin pharmacokinetics and time-kill curves in the HFS-TB. A, The pharmacokinetic model–predicted gatifloxacin concentrations are shown with the shaded graph lines, while the concentrations observed on direct measurement are shown as the symbols. The concentrations achieved were used to calculate the 24 hr AUC and AUC/MICs. B, Time-kill curves based on log10 CFU/mL versus the AUC/MIC achieved in each HFS-TB unit revealed a biphasic decline at each exposure. C, There was an emergence of a gatifloxacin-resistant subpopulation on days 14 and 21 in the 3 lowest exposures, while higher exposures suppressed resistance. In the non-treated controls, the percentage of the subpopulation that was gatifloxacin-resistant did not change and remained close to 0%. D, When bacterial burden was expressed as TTP, the bacterial burden demonstrated the same biphasic pattern, but starting at day 14 and with rebound or regrowth in virtually all systems. None of the HFS-TB units demonstrated complete sterilization with monotherapy. Abbreviations: AUC, area under the concentration-time curve; CFU, colony forming units; HFS-TB, hollow fiber system model of tuberculosis; MIC, minimum inhibitory concentration; Mtb, Mycobacterium tuberculosis; TTP, time-to-positivity.

