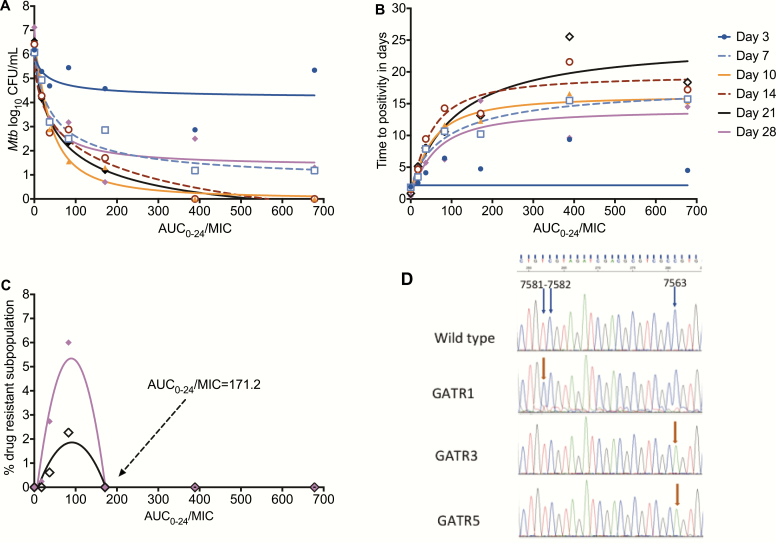
Figure 3.
Exposure versus effect models for microbial kill and acquired resistance. A, Inhibitory sigmoid Emax curves for gatifloxacin microbial kill in log10 CFU/mL for each day of sampling. The EC80s can be read off the graphs for each day at the inflection point of each curve. B, The same inhibitory sigmoid curves, based on TTP readout. The model fit was better with this readout (except on day 3) than with log10 CFU/mL. C, Quadratic function model for acquired drug resistance revealed a model fit associated with an r2 = 0.82 on day 21 (black) and r2 = 0.90 on day 28 (magenta). The AUC/MIC of 171.2 is shown, which was associated with resistance suppression. D, Illustration of mutations in gyrA of some gatifloxacin-resistant isolates. The mutations cluster at position 7563 of gyrA in all resistant isolates but 1. Abbreviations: AUC, area under the concentration-time curve; CFU, colony forming units; EC80, exposure associated with 80% of maximal kill; Emax, maximal kill exposure; gyrA, gyrase subunit A; MIC, minimum inhibitory concentration; Mtb, Mycobacterium tuberculosis; TTP, time-to-positivity.

