Figure 6.
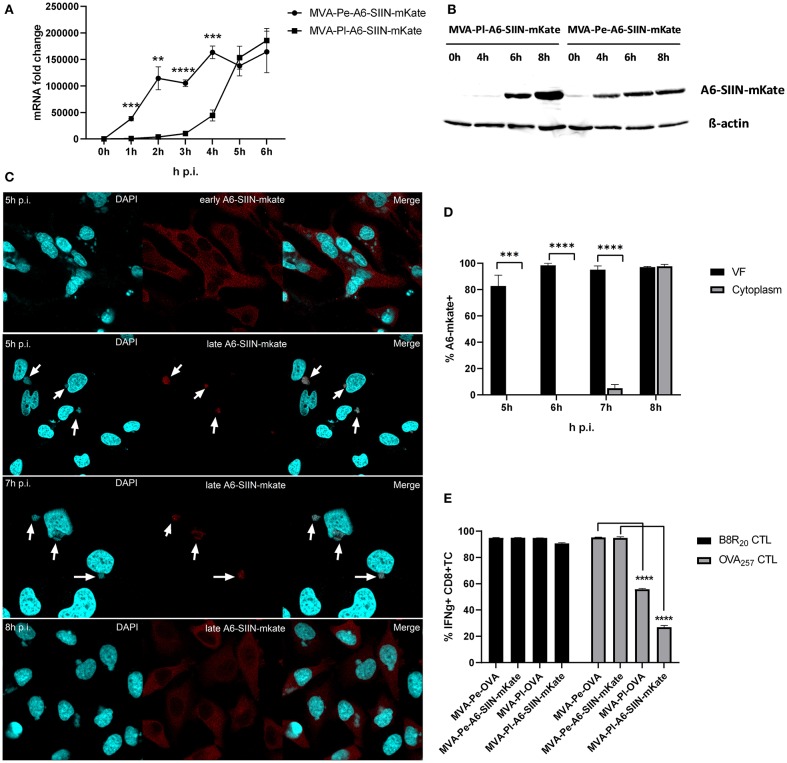
Presentation of viral late antigen A6 to CTL is impaired. (A) mRNA expression kinetics for A6-SIIN-mKate in BMDC infected with MVA-Pe-A6-SIIN-mKate (early expression) or MVA-Pl-A6-SIIN-mKate (late expression) with MOI 10 between 0 and 6 h p.i. mKate-specific primers were used. Data represent relative expression levels and are displayed as mean and SEM (n ≥ 3) from at least three independent experiments. (B) Synthesis of early and late expressed A6-SIIN-mKate determined by western blot analysis. BMDC were infected with MVA-Pe or Pl-A6-SIIN-mKate for indicated hours. Rabbit anti-mKate Ab was used to detect the A6-SIIN-mKate fusion protein. ß-actin was used as loading control. (C) Localization of A6-SIIN-mKate by CLSM. Early produced A6-SIIN-mKate (upper panel) was localized in the cytoplasm at 5 h p.i. in HeLa cells infected with MVA-Pe-A6-SIIN-mKate. Late A6-SIIN-eGFP was detectable in VFs at 5 and 6 h p.i and translocated from VFs after 8 h p.i in HeLa cells infected with MVA-Pl-A6-SIIN-mKate. A6-SIIN-mKate (red), Nuclei and VFs (blue).Arrows point to VFs. (D) Quantification and statistical analysis for the colocalization of late A6-SIIN-mKate (% A6-SIIN-mKate+) with VF (black) and/or cytoplasm (gray) in infected cells. Data are means and SEM (n ≥ 30) from three independent experiments. ***P < 0.001; ****P < 0.0001 (two-tailed Student's t-test). (E) Reduced OVA-specific CD8+ T cell activation by late expressed OVA or A6-SIIN-mKate. BMDC were infected with MVA-Pe-OVA (e-ova) or –Pl-OVA (l-ova) or with MVA-Pe-A6-SIIN-mKate (e-A6-SIIN-mKate) or Pl-A6-SIIN-mKate (l-A6-SIIN-mKate) for 8 h. B8-specific T cell line was used as infection control. IFNg production was determined by ICS followed by FACS analysis. Data are means and SEM (n ≥ 3) from three independent experiments. *P < 0.05; **P < 0.01; ***P < 0.001; ****P < 0.0001 (two-tailed Student's t-test).

