Figure 7.
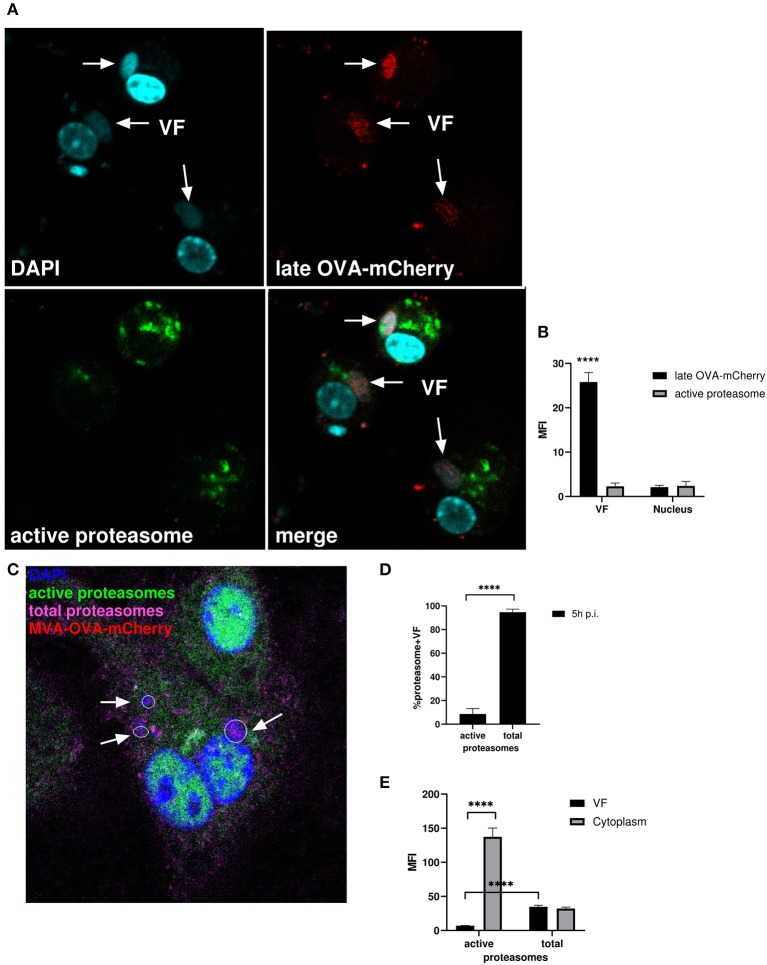
Active proteasomes were absent in VFs. (A) CLSM. BMDC were infected for 5 h with MVA-Pl-OVA-mCherry at MOI 10 to mark infected cells and VFs. Active proteasomes (green) were detected in infected cells (red) using Proteasome Activity Probe. Nuclei and VFs were stained by DAPI (blue). White arrows indicate VFs. (B) Quantification of (A). Late OVA-mCherry (black bar) or active proteasomes (gray bar) inside VF or nuclei. VF and nuclei area were masked by Fuji auto threshold methods MaxEntropy. MFI is calculated by redirecting those areas to red (OVA-mCherry) or green fluorescence (active proteasome). (C) CLSM, higher magnification area from Supplementary Figure 4B. BMDC were infected with MVA-OVA-mCherry at MOI 10 for 5 h. Active proteasomes (green) were detected by using Proteasome Activity Probe. Total proteasomes (pink) were determined with anti-proteasome 20S alpha 1+2+3+5+6+7 antibody. Nuclei and VFs were stained by DAPI (blue). Inactive proteasomes within VF (purple). Arrows mark VFs. (D,E) Quantification of (C and Supplementary Figure 4B). (D) Frequency of VFs positive for total or active proteasomes in MVA-infected BMDC. (E) MFI of active proteasomes (green) or total proteasomes (purple) in VF or cytoplasm. MFI is calculated as described in (B). All pictures are representative for one of three independent experiments. (B,D,E) Show data as means and SEM (n ≥ 30 cells) from three independent experiments, ****P < 0.0001 (two-tailed Student's t-test).

