Figure 8.
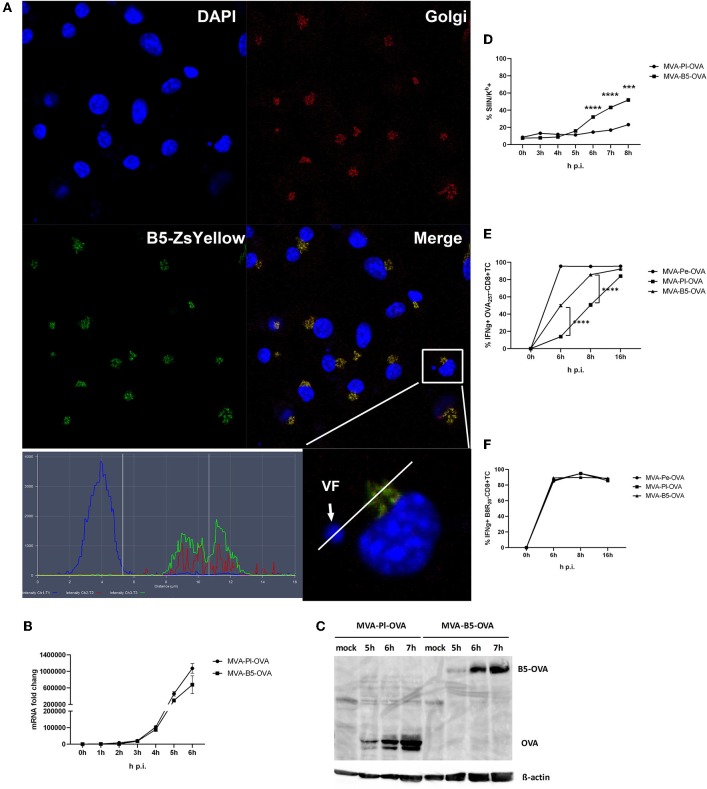
Enhanced antigen processing and presentation as well as CD8+ T cell activation when late antigen is not sequestered in VFs. (A) For CLSM, BMDC were infected with MVA-B5-ZsYellow at MOI 10 for 5 h. DAPI (blue), B5-ZsYellow (green) and Golgi (red) stained by GM130 antibody. Picture is representative for one of three independent experiments. Right panel shows the color profile of an infected cell at higher magnification. ImageJ colocalization analysis showed B5 and Golgi have Pearson's Coefficient R = 0.548. (B) The mRNA expression kinetics for OVA in BMDC infected with either MVA-Pl-OVA (late expression of OVA under control of the P11 promoter) or MVA-B5-OVA (late expression of OVA fused to B5 (B5-OVA) under control of the natural B5 promoter) for 0–6 h p.i. OVA-specific primers were used. Data represent relative expression levels and are displayed as means and SEM (n ≥ 3) from at least three independent experiments. (C) BMDC were infected with MVA-Pl-OVA or MVA-B5-OVA at MOI 10 for indicated hours. For western blot analysis cell lysates were immunoblotted and OVA detected by using rabbit anti-ova antibody. (D) Kinetic analysis of SIINFEKL/Kb complex expression at the surface of MVA-B5-OVA or MVA-Pl-OVA infected BMDC (MOI 10). Mouse anti-SIINFEKL/Kb APC antibody was used. Frequency of SIINFEKL/Kb+ cells (% SIIN-Kb+ cells) is shown. (E,F) BMDC were infected with MVA-Pe-OVA, MVA-Pl-OVA or MVA-B5-OVA at MOI 10 for indicated hours and afterwards co-incubated with OVA- or B8-specific CD8+ T cells. IFNg production (ICS followed by FACS analysis) is shown. Data are means and SEM (n ≥ 3) from three independent experiments. ***P < 0.001, ****P < 0.0001 (two-tailed Student's t-test).

