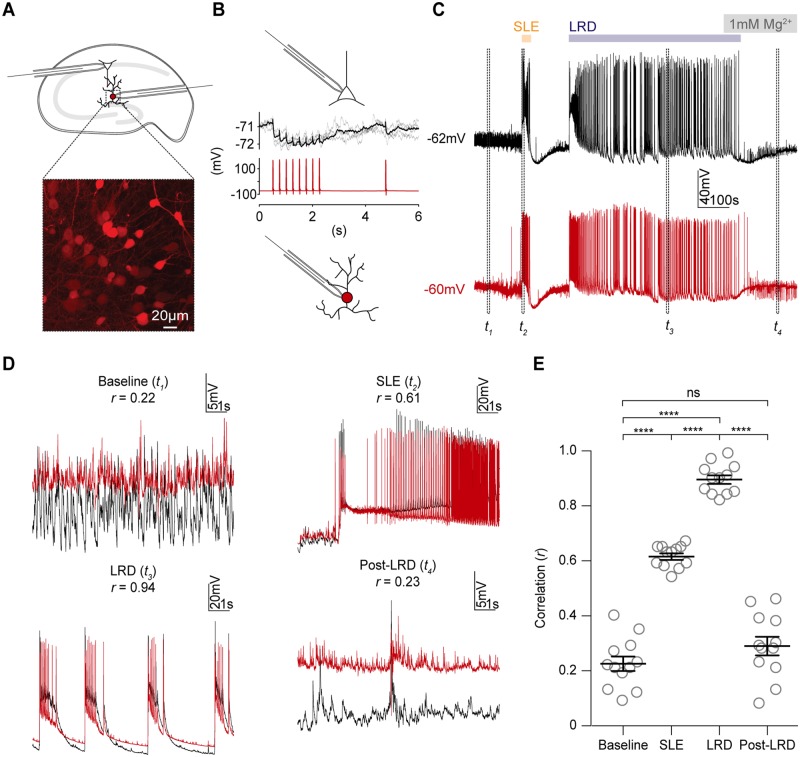
Figure 6.
GABA-releasing interneurons are active and highly correlated with pyramidal cell activity during the late recurrent discharge phase.(A) Diagram of the experimental setup (top), which involved simultaneous whole-cell patch-clamp recordings from CA1 pyramidal neurons and GABAergic interneurons in organotypic hippocampal brain slices (n = 12). Inset: Confocal images show interneurons in the stratum radiatum expressing tdTomato using the cre-lox system (tdTomato reporter line crossed with GAD2-cre line). (B) GABAergic connection between pyramidal cell (black) and GAD2+ interneuron (red) confirmed by observing negative shifts in the pyramidal cell membrane potential when action potentials were generated in the interneuron. Only 3 of 12 paired recordings showed functional inhibitory synaptic connections. (C) Dual current-clamp recordings from the same cells in B during progression of 0 Mg2+ seizure-like activity. Four periods are denoted by dashed rectangles: baseline (t1), at the start of a single SLE (t2), during the LRD phase (t3) and after epileptiform activity had been aborted with the re-introduction of 1 mM Mg2+, post-LRD (t4). (D) Insets show the four periods in C, with recordings from the two neurons superimposed to reveal the extent of synchronous activity. The Pearson’s coefficient (r) was calculated from a direct linear correlation of the two raw traces during each epoch (8-s duration). (E) Population data showing significant increases in correlation during single SLEs (t2) and the LRD phase (t4) (baseline mean r = 0.2 ± SEM 0.03; SLEs mean r = 0.6 ± SEM 0.01; LRD mean r = 0.90 ± SEM 0.02, post mean r = 0.29 ± SEM 0.03, P < 0.0001, paired t-tests,). Furthermore, the synchrony between pyramidal cells and interneurons was greater during LRD compared to during single SLEs (mean r = 0.9 versus mean r = 0.6, P < 0.0001, paired t-test). GAD2 = glutamic acid decarboxylase 2; ns = non-significant; SR = stratum radiatum; Td = tandem dimeric tomato. ****P ≤ 0.0001; ns = not significant (P ≥ 0.05); error bars indicate mean ± SEM.

