Figure 1.
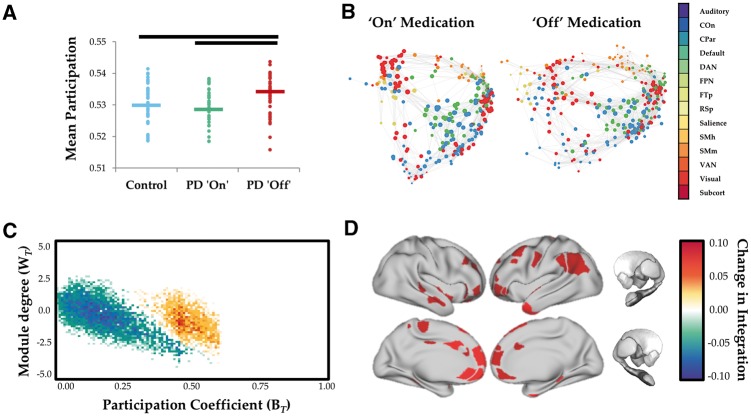
Network topology as a function of dopaminergic state. (A) Global mean participation coefficient (BT) in controls (blue), Parkinson’s disease ON (green) and Parkinson’s disease OFF (red). P < 0.001. (B) Force-directed plots comparing Parkinson's disease ON and OFF dopaminergic medication. Edges represent top 1% of connections in time averaged connectivity matrix and colours of nodes reflect predefined network identity of each region. (C) Cartographic profile comparing Parkinson’s disease OFF > Parkinson’s disease ON. Subjects were more integrated (i.e. rightward shift on the BT axis) in the OFF compared to the ON state. (D) Surface plot of regions with significantly increased participation (BT) during OFF state. COn = cingulo-opercular network; CPar = cingulo-parietal network; DAN = dorsal attention network; FPN = frontoparietal network; FTp = fronto-temporal network; PD = Parkinson’s disease; RSp = retrosplenial network; SMh = somatomotor hand network; SMm = somatomotor mouth network; VAN = ventral attention network; Subcort = subcortical network.

