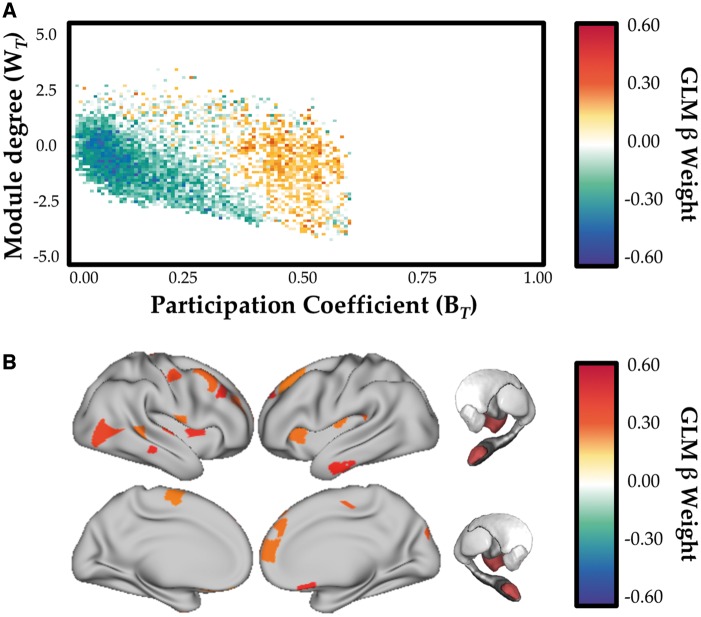
Figure 4.
Relationship between network topology and neurocognitive reserve. (A) Relationship between cartographic profile (Parkinson’s disease OFF > Parkinson’s disease ON) and interaction between grey matter volume and education level (NART). FDR q ≤ 0.05. Subjects with greater NART and grey matter scores were more integrated (i.e. rightward shift on the BT axis) in the OFF compared to the ON state. (B) Regions with significant relationship between BT (OFF > ON) and the interactions between brain (mean grey matter) and cognitive (NART) reserve, estimated using a linear mixed effects model. FDR q ≤ 0.05. GLM = general linear model.

